US Dollar Outlook: USD/CAD
USD/CAD trades to a fresh monthly high (1.3786) as it extends the series of higher highs and lows carried over from last week, and the exchange rate may attempt to test the yearly high (1.3862) as the Relative Strength Index (RSI) flirts with overbought territory.
US Dollar Forecast: USD/CAD RSI Flirts with Overbought Zone
USD/CAD cleared the September high (1.3695) following the failed attempt to close below the 50-Day SMA (1.3516), and a move above 70 in the RSI is likely to be accompanied by a further advance in the exchange rate like the price action from August.
Join David Song for the Weekly Fundamental Market Outlook webinar. David provides a market overview and takes questions in real-time. Register Here
As a result, USD/CAD may track the positive slope in the moving average on the back of US Dollar strength, and the Non-Farm Payrolls (NFP) report may keep the exchange rate afloat as the update is anticipated to show a 170K rise in September.
US Economic Calendar

In addition, Average Hourly Earnings are projected to hold steady at 4.3% during the same period, and signs of a resilient labor market may encourage the Federal Reserve to further combat inflation as the economy shows little signs of a recession.
However, a weaker-than-expected NFP report may curb the recent advance in USD/CAD as it puts pressure on the Federal Open Market Committee (FOMC) to keep US interest rates on hold, and the exchange rate may face increased volatility during the release as Canada’s Employment report is also expected to show a robust labor market.
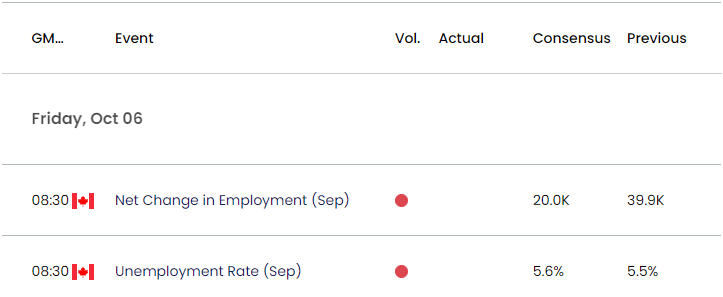
Canada Economic Calendar

Canada is expected to add 20.0K jobs in September following the 39.9K expansion the month prior, and a positive development may sway USD/CAD as the Bank of Canada (BoC) is ‘prepared to increase the policy interest rate further if needed.’
At the same time, a below-forecast Canada Employment print may keep the BoC on the sidelines amid ‘recent evidence that excess demand in the economy is easing,’ and it remains to be seen if USD/CAD will extend the advance from the start of the month as the opening range for October is in focus.
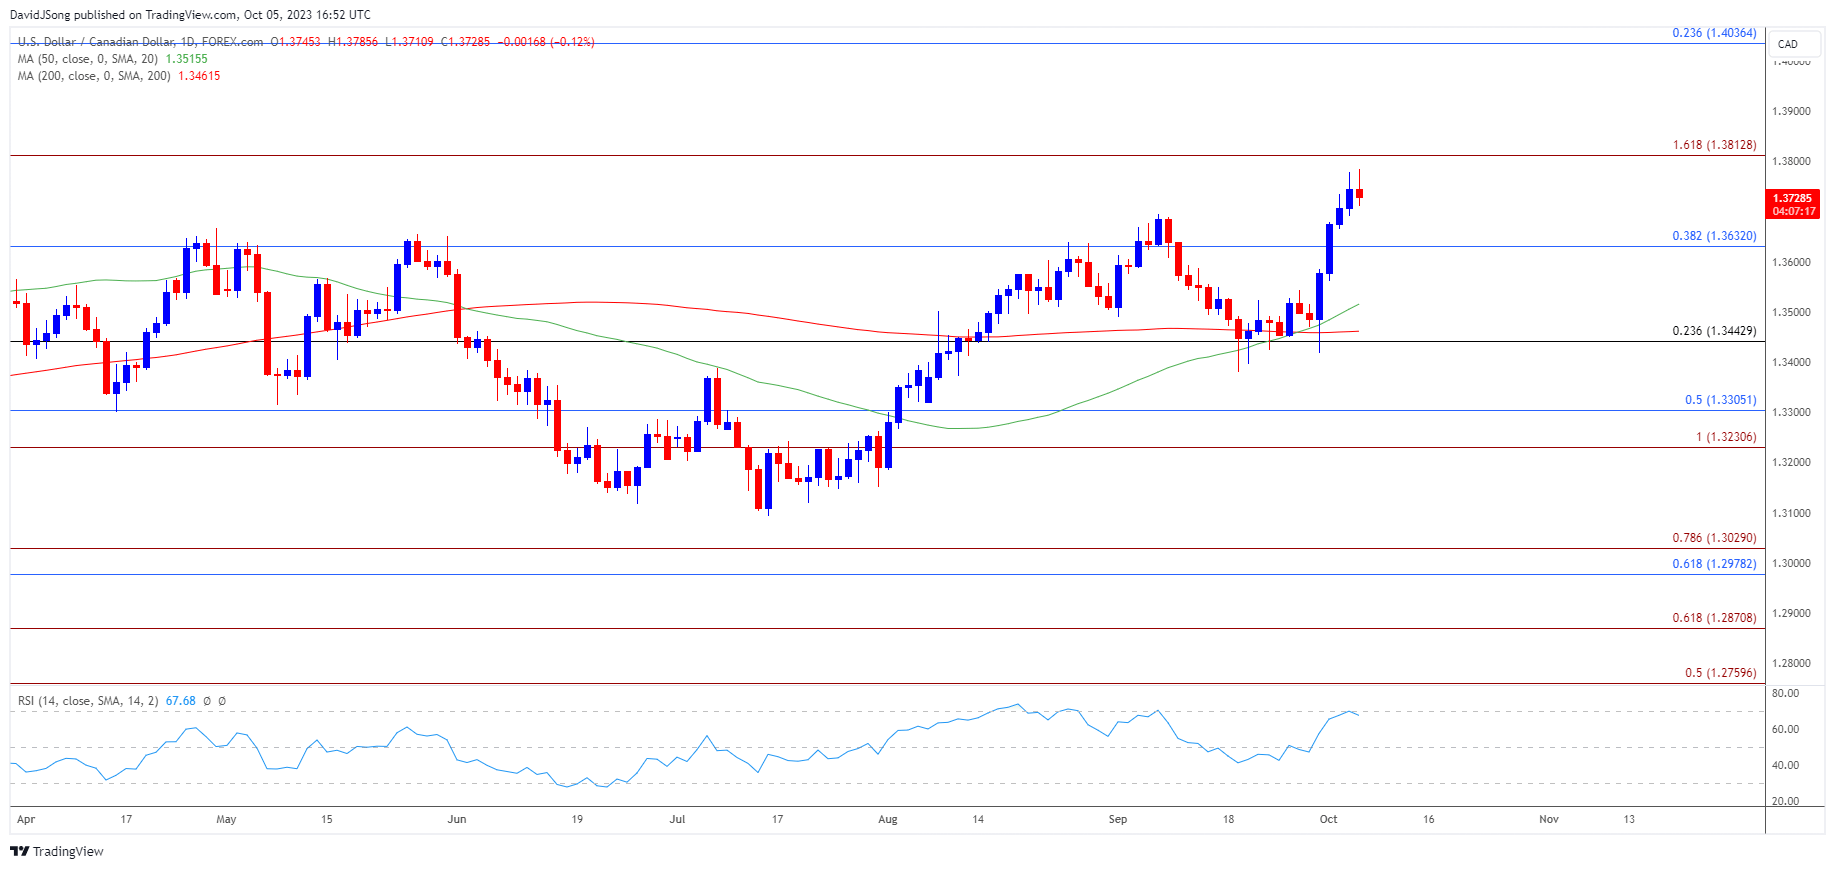
With that said, recent price action may lead to a test of the yearly high (1.3862) as USD/CAD extends the series of higher highs and lows from last week, and a move above 70 in the Relative Strength Index (RSI) is likely to be accompanied by a further advance in the exchange rate like the price action from August.
USD/CAD Price Chart –Daily

Chart Prepared by David Song, Strategist; USD/CAD Price on TradingView
- USD/CAD cleared the September high (1.3695) following the failed attempts to close below the 50-Day SMA (1.3516), with the exchange rate extending the series of higher highs and lows from last week to register a fresh monthly high (1.3786).
- In turn, the Relative Strength Index (RSI) flirts with overbought territory, and a move above 30 in the oscillator is likely to be accompanied by a further advance in USD/CAD like the price action from August.
- A break/close above 1.3810 (161.8% Fibonacci extension) raises the scope for a test of the yearly high (1.3862), with the next area of interest coming in around the 2022 high (1.3978).
- However, the RSI may show the bullish momentum abating if it fails to push above 70, with a move below 1.3630 (38.2% Fibonacci retracement) bringing the monthly low (1.3562) on the radar.
Additional Market Outlooks
GBP/USD Forecast: RSI Recovers from Oversold Territory
US Dollar Forecast: USD/JPY Remains at Threat of FX Intervention
--- Written by David Song, Strategist
Follow on Twitter at @DavidJSong


