US Dollar Outlook: GBP/USD
GBP/USD extends the decline from the monthly high (1.3045) to pull the Relative Strength Index (RSI) back from overbought territory, but the exchange rate may consolidate over the remainder of the week as it tests the former-resistance zone around the March high (1.2894) for support.
US Dollar Forecast: GBP/USD Tests Former Resistance Zone for Support
GBP/USD continues to give back the advance following the UK Consumer Price Index (CPI) as it registers a fresh weekly low (1.2878), and the exchange rate may continue to pare the rally from earlier this month amid the failed attempt to test the 2023 high (1.3143).
Nevertheless, the stickiness in UK inflation may lead to another 7 to 2 split within the Bank of England (BoE) especially as Prime Minister Keir Starmer pushes for fiscal reform, and the Monetary Policy Committee (MPC) may stay on the sidelines at its next meeting on August 1 as ‘monetary policy will need to remain restrictive for sufficiently long to return inflation to the 2% target.’
Join David Song for the Weekly Fundamental Market Outlook webinar. David provides a market overview and takes questions in real-time. Register Here
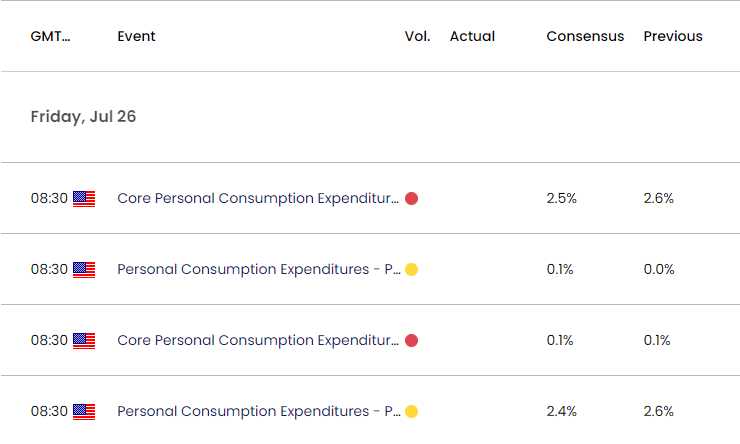
Until then, developments coming out of the US may sway GBP/USD as the Federal Reserve Chairman Jerome Powell endorses a data-dependent approach in managing monetary policy, and the US Personal Consumption Expenditure (PCE) Price Index may push the central bank to further adjust the forward guidance as the update is anticipated to show slowing inflation.
US Economic Calendar

The core PCE is expected to print at 2.5% in June compared to 2.6% the month prior, and another downtick in the Fed’s preferred gauge for inflation may drag on the Greenback as it raises the central bank’s scope to pursue a less restrictive policy.
At the same time, a higher-than-expected PCE print may push the FOMC to keep US interest rates higher for longer, and signs of persistent price growth may generate a bullish reaction in the Greenback as market participants scale back bets for an imminent Fed rate-cut.
With that said, GBP/USD may continue to give back the advance from earlier this month as it reverses ahead of the 2023 high (1.3143), but the exchange rate may consolidate over the remainder of the week as it snaps the series of lower highs and lows carried over from last week.
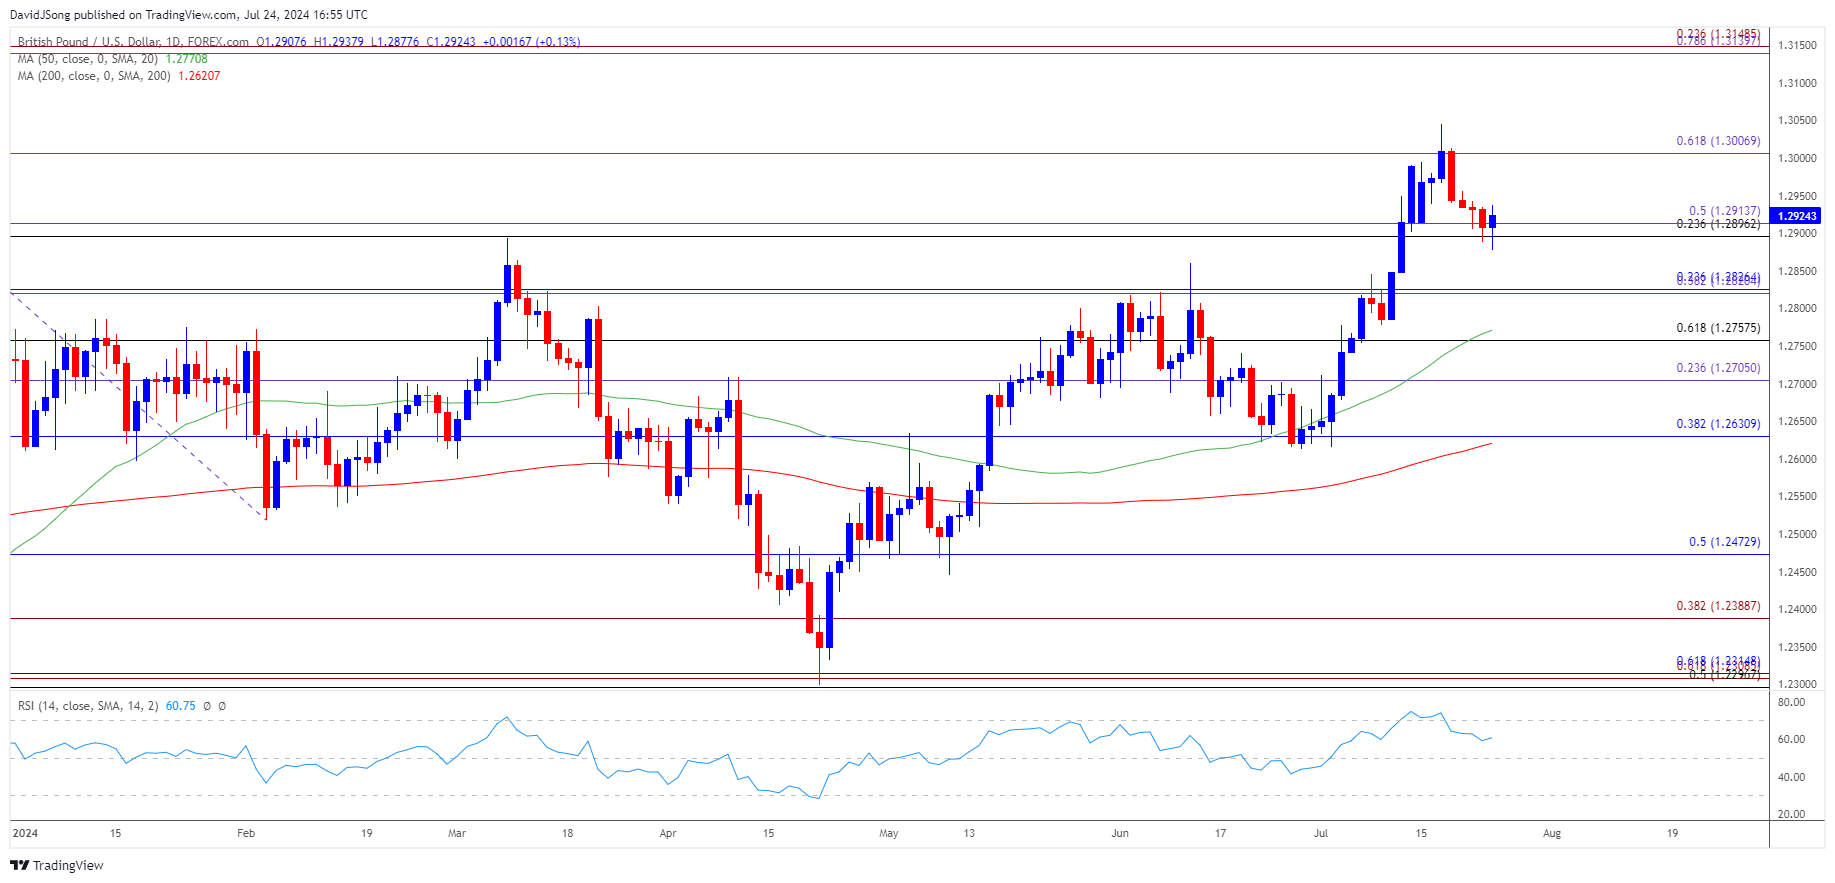
GBP/USD Price Chart –Daily

Chart Prepared by David Song, Strategist; GBP/USD on TradingView
- GBP/USD reversed ahead of the 2023 high (1.3143) to pull the Relative Strength Index (RSI) back from overbought territory, with the exchange rate testing the former-resistance zone around the March high (1.2894) as it registers a fresh weekly low (1.2878).
- A close below the 1.2900 (23.6% Fibonacci retracement) to 1.2910 (50% Fibonacci extension) region may push GBP/USD back towards the 1.2760 (61.8% Fibonacci retracement) to 1.2830 (23.6% Fibonacci retracement) zone, but the exchange rate may track the positive slope in the 50-Day SMA (1.2771) as it snaps the series of lower highs and lows carried over from last week.
- Failure to close below 1.2900 (23.6% Fibonacci retracement) to 1.2910 (50% Fibonacci extension) region may push GBP/USD back towards 1.3010 (61.8% Fibonacci extension), with a breach above the monthly high (1.3045) opening up the 1.3140 (78.6% Fibonacci extension) to 1.3150 (23.6% Fibonacci extension) area, which incorporates the 2023 high (1.3143).
Additional Market Outlooks
US Dollar Forecast: EUR/USD Rally Fizzles Ahead of March High
USD/JPY Reverses Ahead of 50-Day SMA to Approach Monthly Low
--- Written by David Song, Strategist
Follow on Twitter at @DavidJSong


