US Dollar Outlook: GBP/USD
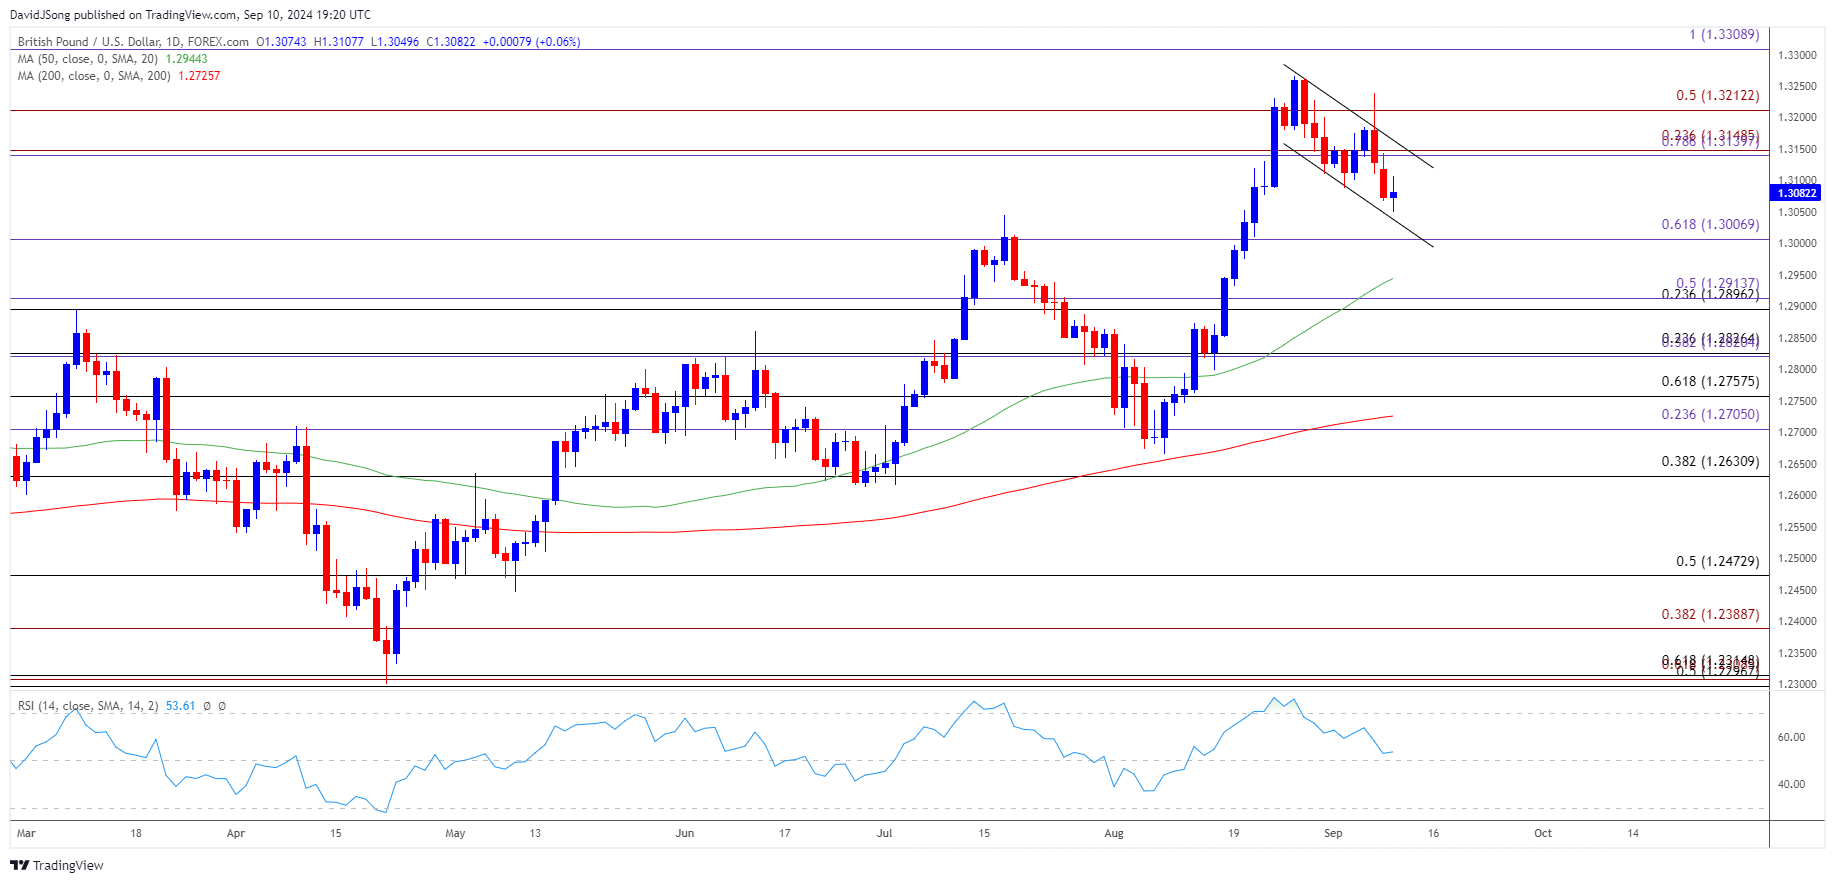
GBP/USD extends the recent series of lower highs and lows to register a fresh monthly low (1.3058), but a bull-flag formation may unfold should the exchange rate track the positive slope in the 50-Day SMA (1.2944).
US Dollar Forecast: GBP/USD Susceptible to Bull-Flag Formation
GBP/USD attempts to retrace the decline from the start of the week as the UK Employment report shows the jobless rate narrowing to 4.1% during the three-months through July from 4.2% the previous period, and developments coming out of the US may also sway the exchange rate as both the Federal Reserve and Bank of England (BoE) are slated to announce their interest rate decisions next week.
Join David Song for the Weekly Fundamental Market Outlook webinar. David provides a market overview and takes questions in real-time. Register Here
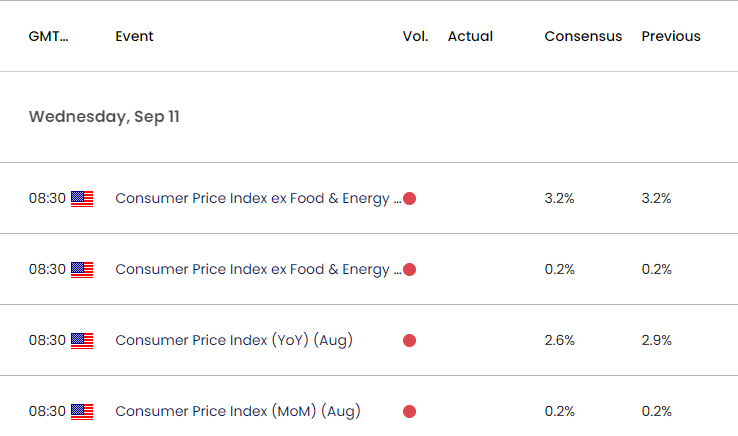
US Economic Calendar

Until then, the update to the US Consumer Price Index (CPI) may sway GBP/USD as the headline reading is seen slowing to 2.6% in August from 2.9% per annum the month prior, but the report may generate a mixed reaction as the core rate of inflation is expected to hold steady at 3.2% during the same period.
With that said, signs of easing price growth may produce headwinds for the US Dollar as it encourages the Fed to unwind its restrictive policy, but evidence of persistent inflation may prop up the Greenback as it limits the central bank’s scope to pursue a rate-cutting cycle.
GBP/USD Price Chart –Daily

Chart Prepared by David Song, Strategist; GBP/USD on TradingView
- GBP/USD remains under pressure after failing to hold within the opening range for September, with the recent series of lower highs and lows bringing 1.3000 (61.8% Fibonacci extension) on the radar.
- Next area of interest comes in around the 50-Day SMA (1.2944) but a bull-flag formation may unfold should GBP/USD track the positive slope in the moving average.
- Need a move back above the 1.3140 (78.6% Fibonacci extension) to 1.3150 (23.6% Fibonacci extension) region for GBP/USD to negate the bearish price action, with a breach above 1.3210 (50% Fibonacci extension) opening up the monthly high (1.3239).
- However, a break/close below 1.3000 (61.8% Fibonacci extension) would undermine the bull-flag formation, and failure to hold above the moving average may push GBP/USD towards the 1.2900 (23.6% Fibonacci retracement) to 1.2910 (50% Fibonacci extension) area.
Additional Market Outlooks
US Consumer Price Index (CPI) Preview (AUG 2024)
Australia Dollar Forecast: AUD/USD Reverses Ahead of January High
EUR/USD Pulls Back Ahead of August High with US CPI in Focus
US Dollar Forecast: USD/JPY Eyes August Low as NFP Report Disappoints
--- Written by David Song, Strategist
Follow on Twitter at @DavidJSong


