US Dollar Outlook: GBP/USD
GBP/USD pulls back from the weekly high (1.2642) to snap the recent series of higher highs and lows, and the exchange rate may no longer track the positive slope in the 50-Day SMA (1.2675) as it struggles to trade back above the moving average.
US Dollar Forecast: GBP/USD Struggles to Trade Back Above 50-Day SMA
Keep in mind, GBP/USD closed below the moving average for the first time since November following the reaction to the stronger-than-expected US Non-Farm Payrolls (NFP) report, and the exchange rate may struggle to retain the advance from the monthly low (1.2518) as Federal Reserve officials show a greater willingness to keep interest rates higher for longer.
Richmond Fed President Thomas Barkin, who votes on the Federal Open Market Committee (FOMC) in 2024, acknowledged that the ‘data has been remarkable across the board,’ with the official going onto say that the committee has ‘got some time to be patient’ during an interview on Bloomberg News.
Join David Song for the Weekly Fundamental Market Outlook webinar. David provides a market overview and takes questions in real-time. Register Here
The comments from Barkin suggest the FOMC is in no rush to switch gears as Chairman Jerome Powell rules out a rate cut in March, and GBP/USD may face headwind ahead of the next Fed meeting as it struggles to retain the rebound from the monthly low (1.2518).
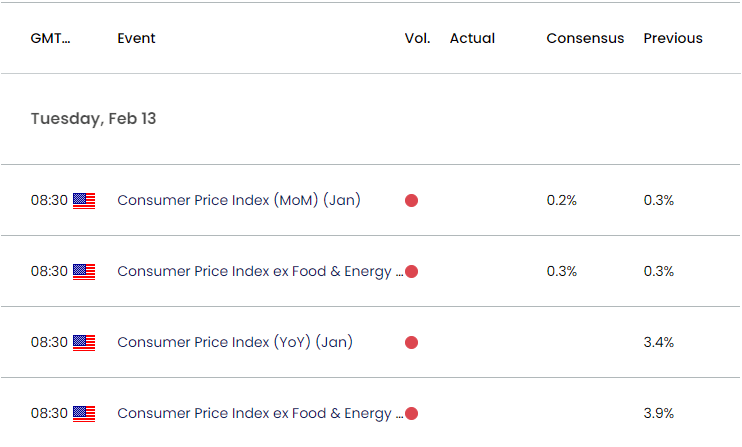
US Economic Calendar

Nevertheless, the update to the US Consumer Price Index (CPI) may generate a bearish reaction in the Greenback as both the headline and core reading are anticipated to show slowing inflation, but a stronger-than-expected print may drag on GBP/USD as it encourages the FOMC to retain the restrictive policy.
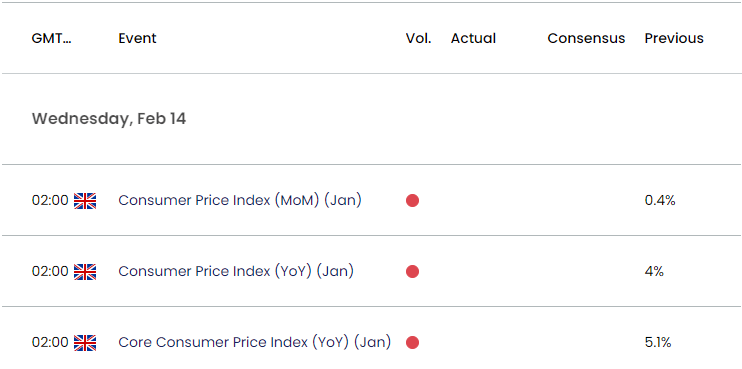
UK Economic Calendar

At the same time, the UK CPI may have a similar impact on the British Pound amid the ongoing dissent within the Bank of England (BoE), and speculation surrounding BoE and Fed policy may sway GBP/USD over the coming days as both central banks continue to combat inflation.
With that said, GBP/USD may consolidate ahead of the key event risks as it fails to extend the recent series of higher highs and lows, but the exchange rate may no longer track the positive slope in the 50-Day SMA (1.2675) as it struggles to trade back above the moving average.
GBP/USD Price Chart –Daily

Chart Prepared by David Song, Strategist; GBP/USD on TradingView
- Keep in mind, GBP/USD cleared the January low (1.2597) after closing below the 50-Day SMA (1.2675) for the first time since November, and the exchange rate may give back the advance from the monthly low (1.2518) if it struggles to trade back above the moving average.
- Failure to defend the December low (1.2500) may push GBP/USD towards 1.2470 (50% Fibonacci retracement), with the next area of interest coming in around 1.2300 (50% Fibonacci retracement) to 1.2390 (38.2% Fibonacci extension).
- At the same time, GBP/USD may face range bound conditions if it continues to hold above the December low (1.2500), with a close above 1.2630 (38.2% Fibonacci retracement) bringing the monthly high (1.2772) on the radar.
Additional Market Outlooks
US Dollar Forecast: USD/JPY Attempts to Breakout of Bull Flag Pattern
EUR/USD Post-NFP Selloff Brings Test of December Low
--- Written by David Song, Strategist
Follow on Twitter at @DavidJSong


