US Dollar Outlook: GBP/USD
GBP/USD approaches the May high (1.2801) as the US ISM Manufacturing Index unexpectedly narrows to 48.7 from 49.2 in April, but the exchange rate may struggle to retain the advance from the May low (1.2446) should the Relative Strength Index (RSI) continue to hold below overbought territory.
US Dollar Forecast: GBP/USD Struggles to Push RSI into Overbought Zone
GBP/USD may attempt to further retrace the decline from the March high (1.2894) as it extends the rebound from last week’s low (1.2681), with the opening range for June is in focus as the exchange rate gained 2% during the previous month.
Join David Song for the Weekly Fundamental Market Outlook webinar. David provides a market overview and takes questions in real-time. Register Here
However, failure to push the RSI above 70 may keep GBP/USD within last week’s range, and the exchange rate may consolidate ahead of the US Non-Farm Payrolls (NFP) report as the update is anticipated to show another rise in employment.
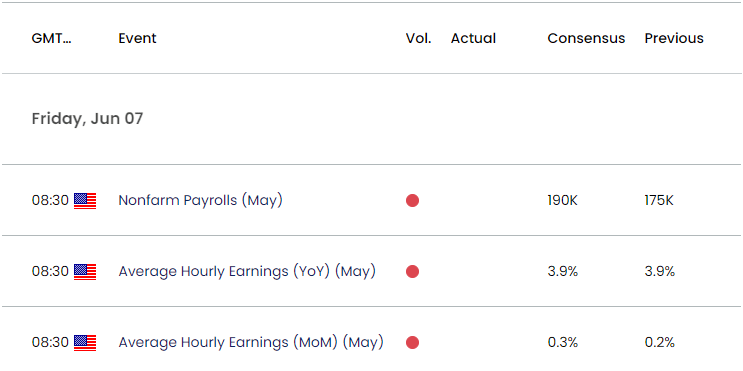
US Economic Calendar

The US is expected to add 190K jobs in May following the 175K expansion the month prior, and a pickup in job growth may spark a bullish reaction in the Greenback as it raises the Federal Reserve’s scope to further combat inflation.
At the same time, a lower-than-expected NFP print may put pressure on the Federal Open Market Committee (FOMC) to alter the course for monetary policy as the central bank is ‘prepared to respond to an unexpected weakening in the labor market,’ and signs of slowing job growth may drag on the Greenback as it fuels speculation for a lower US interest rates.
With that said, GBP/USD may further retrace the decline from the March high (1.2894) if it pushes above the May range, but the Relative Strength Index (RSI) may diverge with price should the oscillator continue to hold below 70.
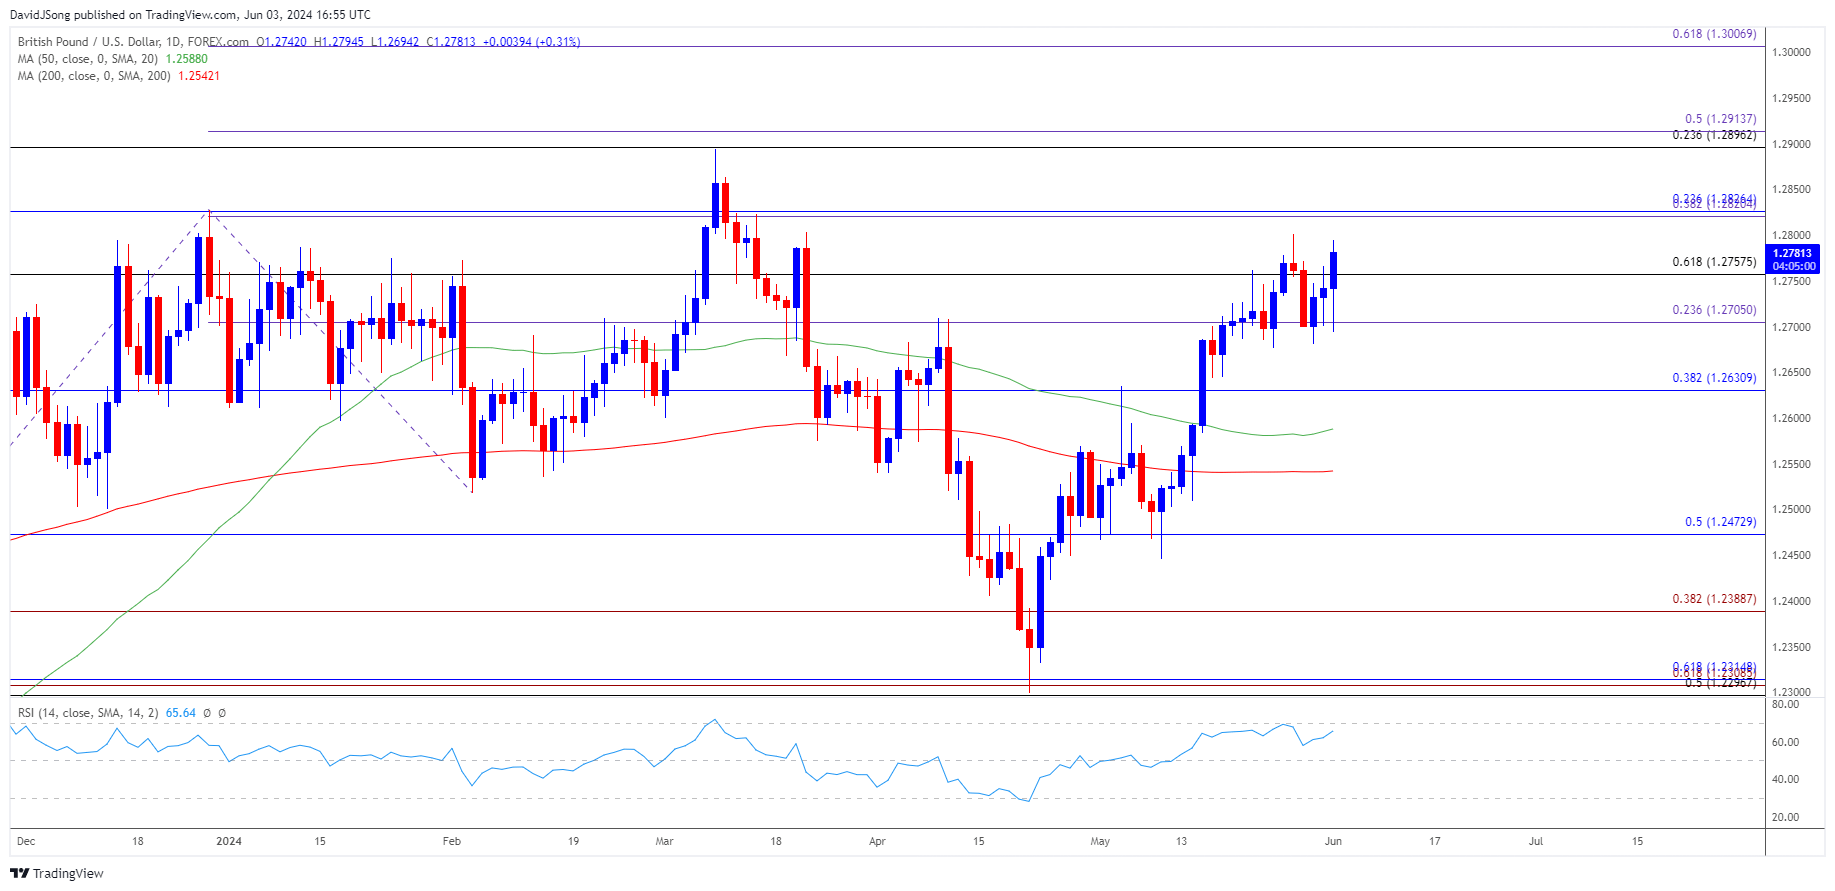
GBP/USD Price Chart –Daily

Chart Prepared by David Song, Strategist; GBP/USD on TradingView
- GBP/USD approaches the May high (1.2801) as it stages a three-day rally, with a break/close above the 1.2760 (61.8% Fibonacci retracement) to 1.2830 (23.6% Fibonacci retracement) region raising the scope for a test of the March high (1.2894).
- Next area of interest comes in around 1.3010 (61.8% Fibonacci extension), but lack of momentum to push the Relative Strength Index (RSI) into overbought territory may undermine the recent strength in GBP/USD.
- A close below 1.2710 (23.6% Fibonacci extension) may push GBP/USD back towards 1.2630 (38.2% Fibonacci retracement), with the next region of interest coming in around 1.2470 (50% Fibonacci retracement).
Additional Market Outlooks
USD/CAD Recovers Ahead of Monthly Low to Preserve Ascending Channel
USD/JPY Eyes Monthly High Ahead of US PCE Report
--- Written by David Song, Strategist
Follow on Twitter at @DavidJSong


