US Dollar Outlook: GBP/USD
GBP/USD slips below the former resistance zone around the December high (1.2828) to pull the Relative Strength Index (RSI) back from overbought territory, but the pullback from the yearly high (1.2894) may end up short lived as it struggles to extend the series of lower highs and lows from the start of the week.
US Dollar Forecast: GBP/USD Slips Below Former Resistance Zone
Keep in mind, GBP/USD broke above the December range earlier this month to briefly kick the RSI above 70 for the first time since November, and the exchange rate may continue to register fresh yearly highs as it retraces the decline following the update to the US Consumer Price Index (CPI).
Join David Song for the Weekly Fundamental Market Outlook webinar. David provides a market overview and takes questions in real-time. Register Here
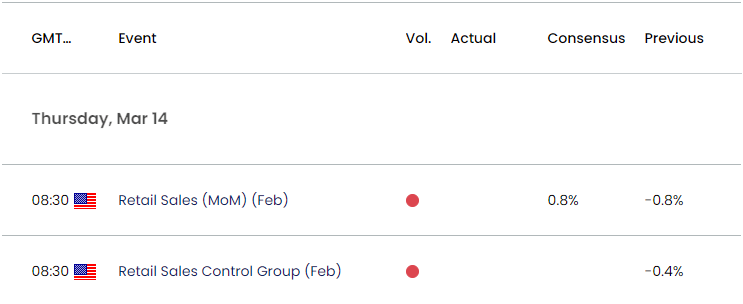
US Economic Calendar

However, data prints coming out of the US may continue to sway GBP/USD as the Retail Sales report is anticipated to show private sector consumption increasing 0.8% in February, and a positive development may generate a bullish reaction in the US Dollar as it raises the Fed’s scope to retain a restrictive policy.
At the same time, a weaker-than-expected Retail Sales report may produce headwinds for the Greenback as it puts pressure on the Federal Open Market Committee (FOMC) to implement lower interest rates, and GBP/USD may attempt to retrace the decline from the monthly high (1.2894) as it no longer carves a series of lower highs and lows.
With that said, GBP/USD may continue to register fresh monthly highs as it breaks out of the December range, but the Relative Strength Index (RSI) may show the bullish momentum abating if it holds below overbought territory and diverges with price.
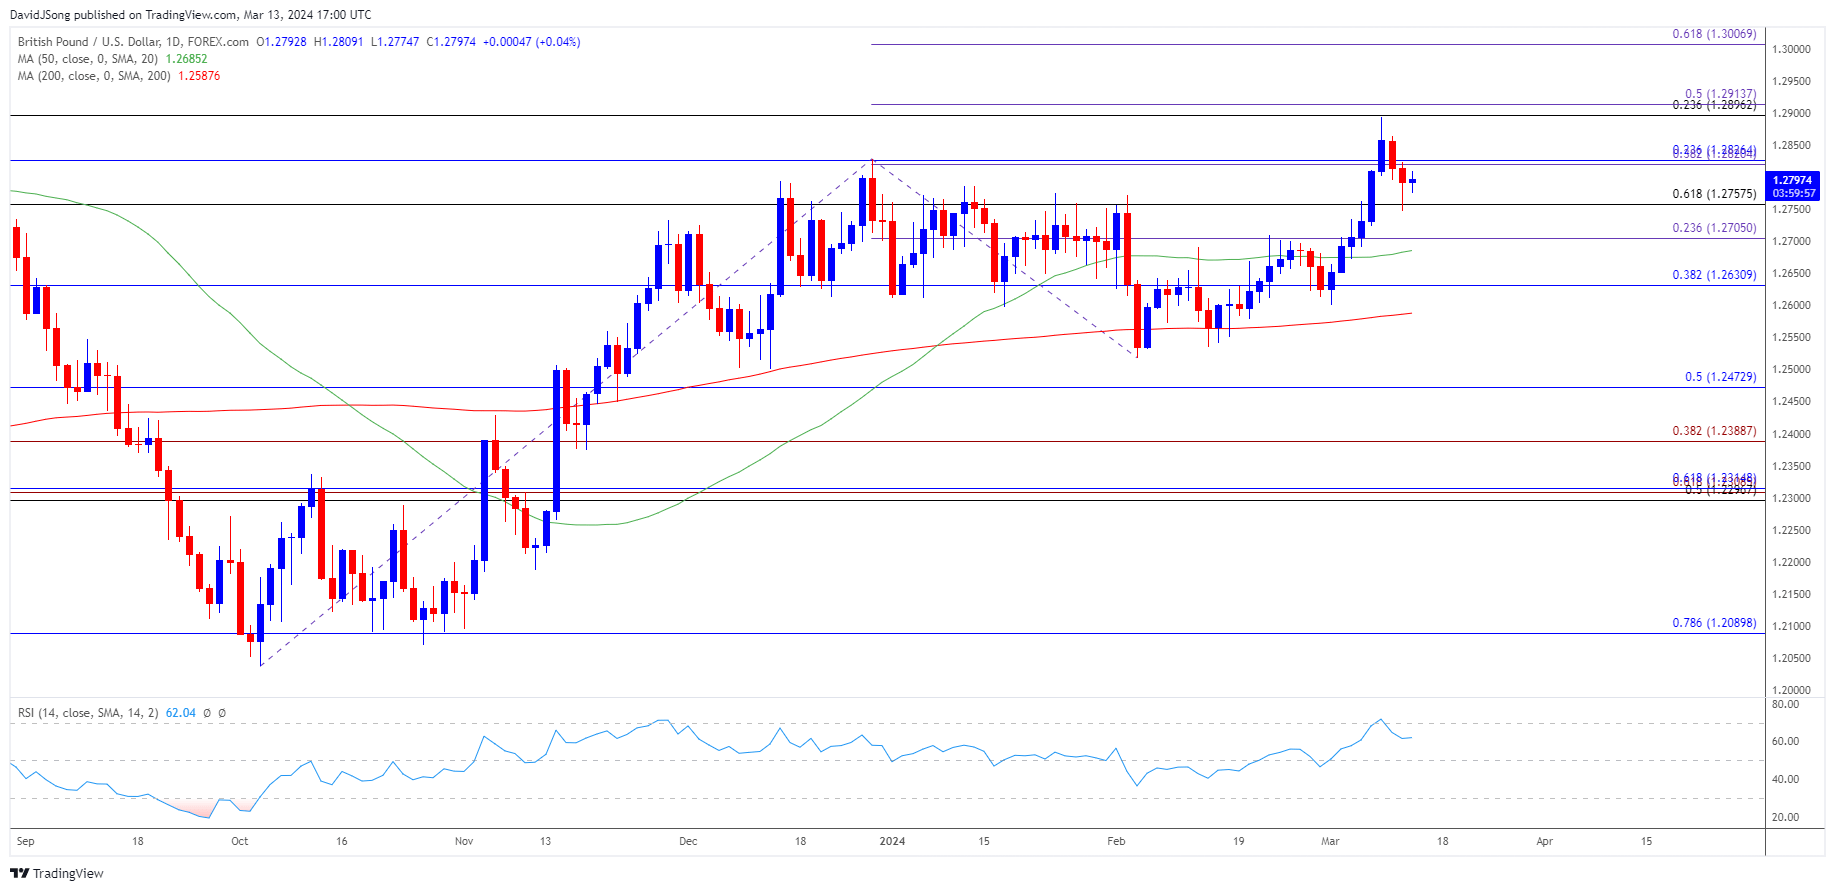
GBP/USD Price Chart –Daily

Chart Prepared by David Song, Strategist; GBP/USD on TradingView
- GBP/USD broke out of the December range to briefly push the Relative Strength Index (RSI) above 70, and the recent pullback from the monthly high (1.2894) may end up short lived as it struggles to extend the series of lower highs and lows from the start of the week.
- GBP/USD may further retrace the decline from the 2023 high (1.3143) as long as it maintains the advance from the start of the month, with a break/close above the 1.2900 (23.6% Fibonacci retracement) to 1.2910 (50% Fibonacci extension) opening up 1.3010 (61.8% Fibonacci extension),
- Next area of interest comes in around 1.3140 (78.6% Fibonacci extension) to 1.3150 (23.6% Fibonacci extension), but the RSI may show the bullish momentum abating if it holds below overbought territory and diverges with price.
- Failure to defend the 1.2760 (61.8% Fibonacci retracement) to 1.2830 (23.6% Fibonacci retracement) region may push GBP/USD 1.2710 (23.6% Fibonacci extension), with a breach below 1.2630 (38.2% Fibonacci retracement) raising the scope for a test of the monthly low (1.2600).
Additional Market Outlooks
US Dollar Forecast: USD/CAD No Longer Trades in Ascending Channel
US Dollar Forecast: EUR/USD Rally Brings January High on Radar
--- Written by David Song, Strategist
Follow on Twitter at @DavidJSong


