US Dollar Outlook: GBP/USD
GBP/USD struggles to hold its ground going into the Federal Reserve interest rate decision amid the pickup in the US Employment Cost Index (ECI), but the exchange rate may further retrace the decline from the April high (1.2710) if it shows a limited response to the negative slope in the 50-Day SMA (1.2617).
US Dollar Forecast: GBP/USD Recovery Stalls Ahead of 50-Day SMA
The recent recovery in GBP/USD seems to have stalled ahead of the moving average as it slips to a fresh weekly low (1.2466), and it remains to be seen if the Fed will sway the near-term outlook for the exchange rate as the central bank is anticipated to retain the status quo.
Join David Song for the Weekly Fundamental Market Outlook webinar. David provides a market overview and takes questions in real-time. Register Here
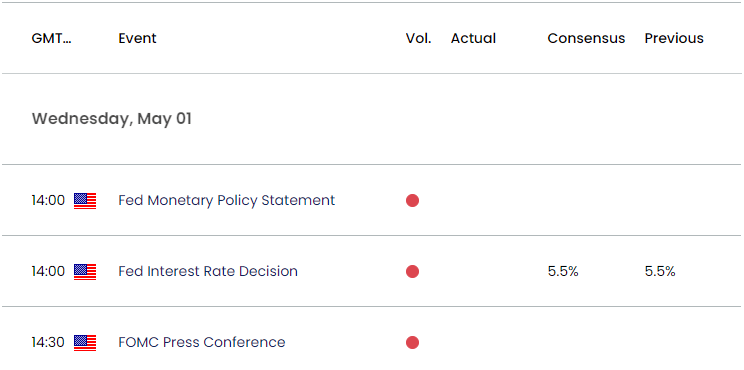
The Federal Open Market Committee (FOMC) is widely expected to keep the benchmark interest rate in its current threshold of 5.25% to 5.50%, and the central bank may leave the door open for a less restrictive policy as officials warn that ‘an unexpected weakening in the labor market could also warrant a policy response.’
US Economic Calendar

In turn, speculation for a looming change in regime may drag on the US Dollar as the FOMC starts to discuss ‘issues related to slowing the pace of decline in our securities holdings,’ but the Fed may show a greater willingness to keep US interest rates higher for longer as Chairman Jerome Powell and Co. see a lack of progress in bringing down inflation towards the 2% target.
As a result, the FOMC may further combat inflation by keeping US interest rates higher for longer, and a hawkish forward guidance may spark a bullish reaction in the Greenback as market participants push out bets for a Fed rate cut.
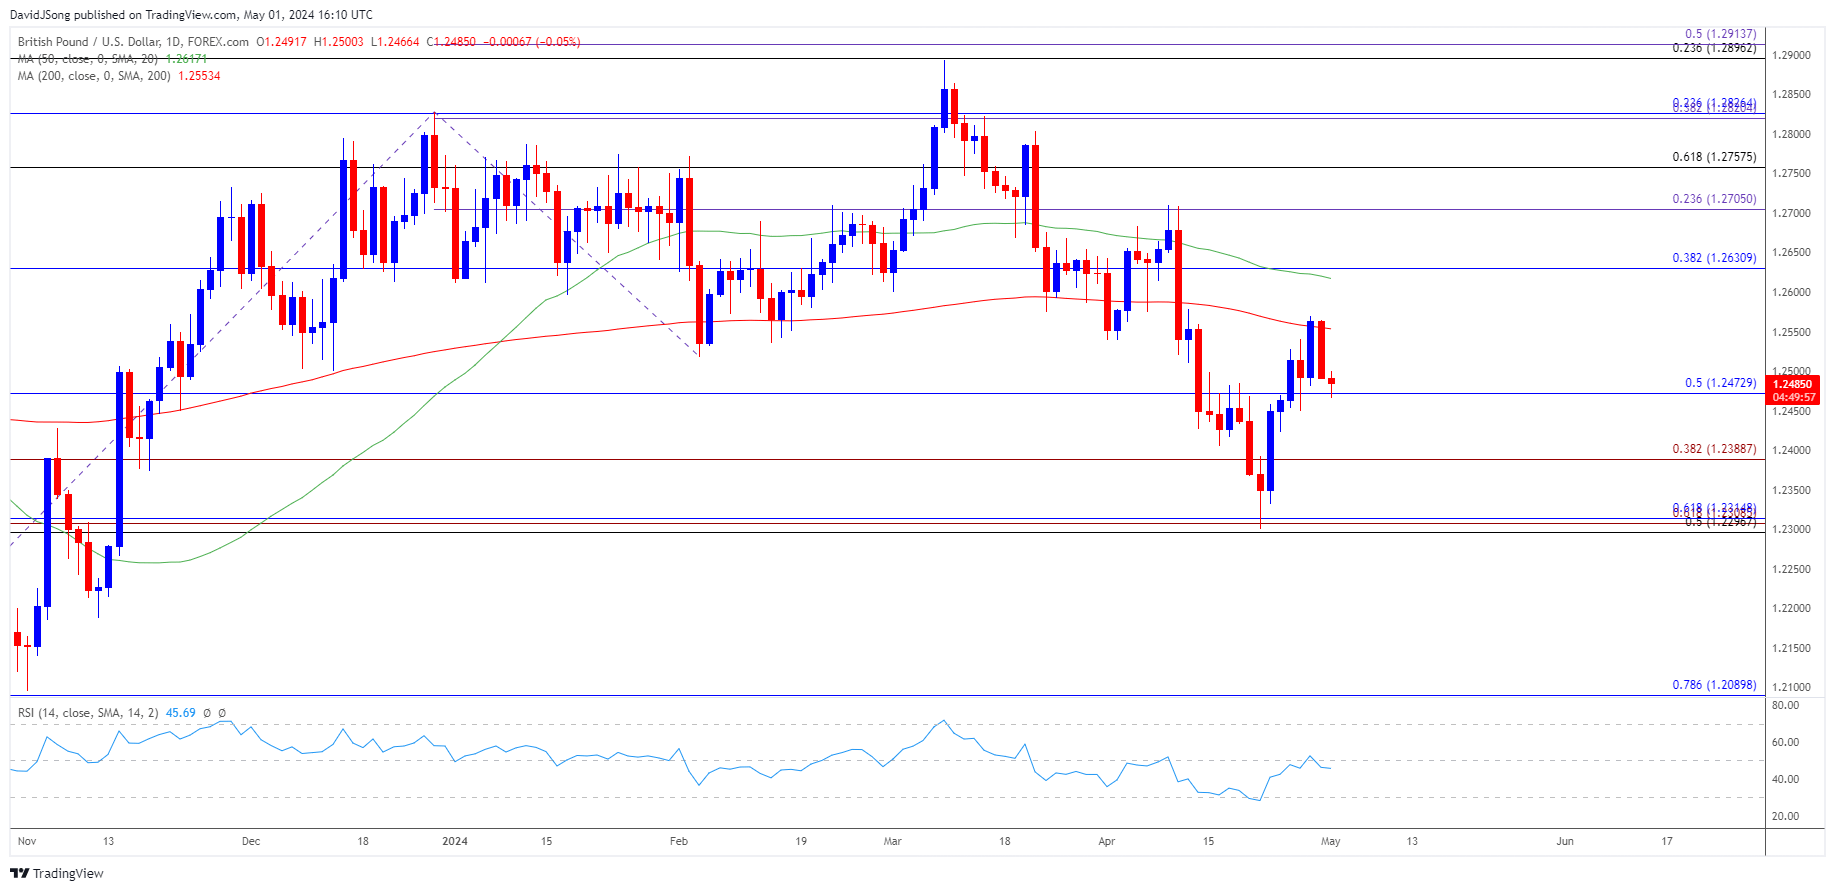
With that said, GBP/USD may struggle to retain the advance from the April low (1.2300) as it appears to be reversing ahead of the 50-Day SMA (1.2617), but the exchange rate may further retrace the decline from the April high (1.2710) if it shows a limited response to the negative slope in the moving average.
GBP/USD Price Chart –Daily

Chart Prepared by David Song, Strategist; GBP/USD on TradingView
- The recent recovery in GBP/USD seems to have stalled ahead of the 50-Day SMA (1.2617) as it slips to a fresh weekly low (1.2466), with a close below 1.2470 (50% Fibonacci retracement) raising the scope for a move towards 1.2390 (38.2% Fibonacci extension).
- Next area of interest comes in around the April low (1.2300), with a break/close below the 1.2300 (50% Fibonacci retracement) to 1.2320 (61.8% Fibonacci retracement) region opening up the November low (1.2096).
- However, failure to close below 1.2470 (50% Fibonacci retracement) may push GBP/USD back above the moving average, with a break/close above 1.2630 (38.2% Fibonacci retracement) bringing the April high (1.2710) on the radar.
Additional Market Outlooks
US Dollar Forecast: EUR/USD Susceptible to Bear Flag Formation
US Dollar Forecast: AUD/USD Rebound Persists Ahead of Australia CPI
--- Written by David Song, Strategist
Follow on Twitter at @DavidJSong


