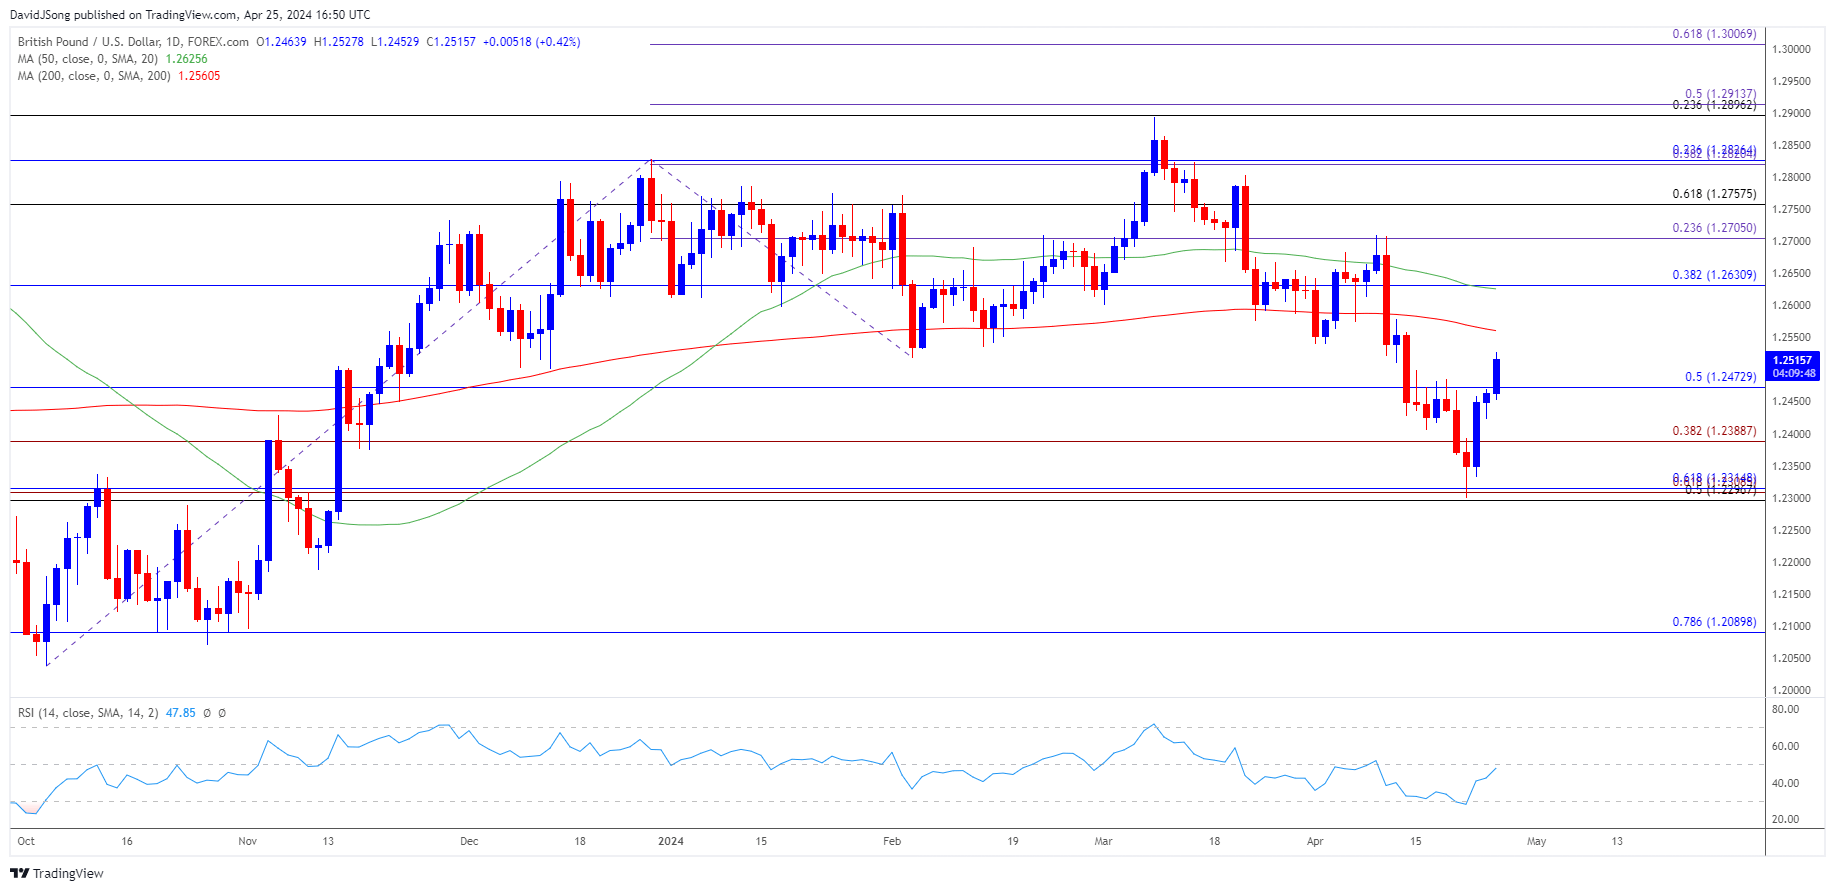
US Dollar Outlook: GBP/USD
GBP/USD pulls back from a fresh weekly high (1.2528) as the US Gross Domestic Product (GDP) report reveals persistent inflation, but the exchange rate may attempt to further retrace the decline from the monthly high (1.2710) as it carves a series of higher highs and lows.
US Dollar Forecast: GBP/USD Recovery Continues Ahead of US PCE Report
GBP/USD struggles to retain the advance from earlier this week even though the US 1Q GDP report shows a 1.6% rise versus forecasts for a 2.5% print as the core Personal Consumption Expenditure (PCE) Price Index, the Federal Reserve’s preferred gauge for inflation, jumps to 3.7% from 2.0% during the same period to exceed forecasts for a 3.4% reading.
Join David Song for the Weekly Fundamental Market Outlook webinar. David provides a market overview and takes questions in real-time. Register Here
Signs of ongoing price growth may push the Federal Open Market Committee (FOMC) to keep US interest rate higher for longer as Chairman Jerome Powell and Co. warn of a lack of progress in bringing down inflation towards the 2% target, and it remains to be seen if the Fed will adjust its forward guidance at the next rate decision on May 1 as the central bank promotes a data-dependent approach in managing monetary policy.
US Economic Calendar

Until then, the update to the US Personal Consumption Expenditure (PCE) Price Index may sway GBP/USD and signs of slowing inflation may produce headwinds for the Greenback as it would keep the Fed on track to carry out a less restrictive policy in 2024.
However, a higher-than-expected reading for the core PCE may curb the recent recovery in GBP/USD as it puts pressure on the FOMC to keep US interest rate higher for longer, and the exchange rate may start to exhibit a bearish trend as the 50-Day SMA (1.2625) now reflects a negative slope.
With that said, the advance from the monthly low (1.2300) may unravel should GBP/USD snaps the recent series of higher highs and lows, but a further recovery in the exchange rate may continue to pull the Relative Strength Index (RSI) away from oversold territory following the brief move below 30 earlier this month.
GBP/USD Price Chart –Daily

Chart Prepared by David Song, Strategist; GBP/USD on TradingView
- GBP/USD carves a series of higher highs and lows after failing to break/close below the 1.2300 (50% Fibonacci retracement) to 1.2320 (61.8% Fibonacci retracement) region, with a breach above 1.2630 (38.2% Fibonacci retracement) bringing the monthly high (1.2710) on the radar.
- Need a close above 1.2630 (38.2% Fibonacci retracement) to open up 1.2710 (23.6% Fibonacci extension), but GBP/USD may struggle to retain the advance from the monthly low (1.2300) if it responds to the negative slope in the 50-Day SMA (1.2625).
- Failure holds above 1.2470 (50% Fibonacci retracement) may push GBP/USD back towards 1.2390 (38.2% Fibonacci extension), with a break/close below the 1.2300 (50% Fibonacci retracement) to 1.2320 (61.8% Fibonacci retracement) region opening up the November low (1.2096).
Additional Market Outlooks
US Dollar Forecast: EUR/USD Susceptible to Bear Flag Formation
US Dollar Forecast: AUD/USD Rebound Persists Ahead of Australia CPI
--- Written by David Song, Strategist
Follow on Twitter at @DavidJSong


