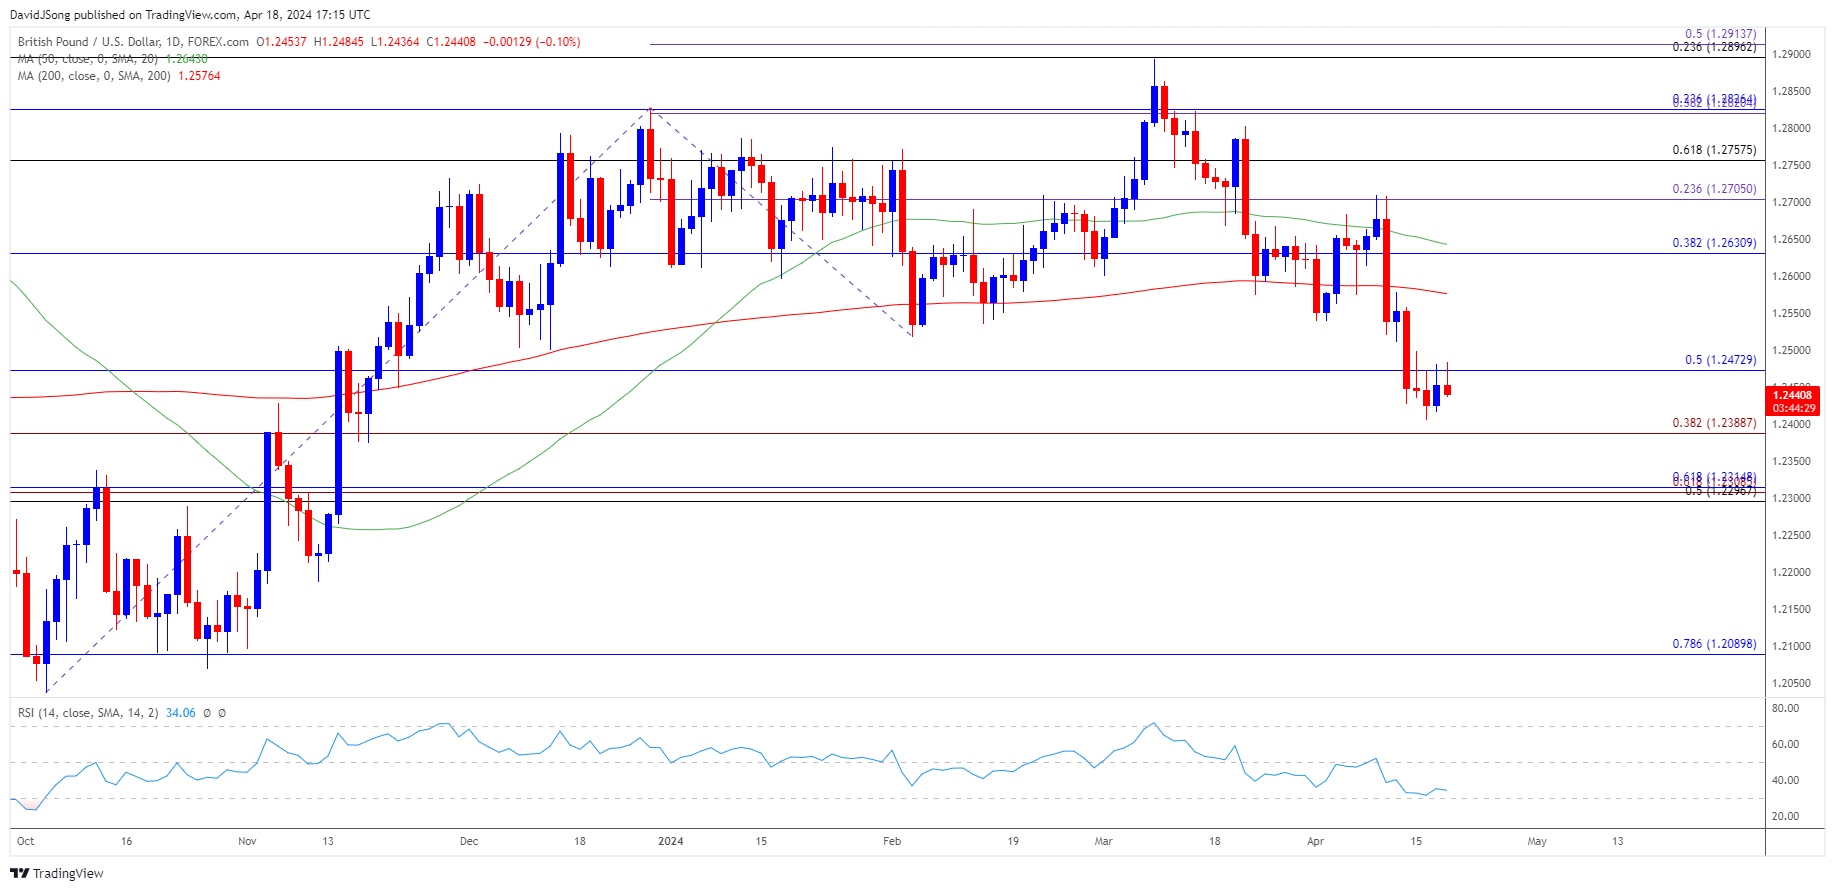
British Pound Outlook: GBP/USD
GBP/USD seems to be defending the advance following the higher-than-expected UK Consumer Price Index (CPI) to keep the Relative Strength Index (RSI) above 30, and the exchange rate may stage a larger recovery as it carves a series of higher highs and lows.
US Dollar Forecast: GBP/USD Rebound Keeps RSI Out of Oversold Zone
GBP/USD holds above the monthly low (1.2406) even as Federal Reserve officials show a greater willingness to keep US interest rates higher for longer, and the RSI may show the bearish momentum abating if it continues to move away from oversold territory.
Join David Song for the Weekly Fundamental Market Outlook webinar. David provides a market overview and takes questions in real-time. Register Here
Meanwhile, it remains to be seen if the Bank of England (BoE) will respond to the inflation report as Monetary Policy Committee (MPC) officials no longer vote for higher interest rates, and the majority may continue to endorse a wait-and-see approach at the next interest rate decision on May 9 as the central bank remains ‘prepared to adjust monetary policy as warranted by economic data to return inflation to the 2% target sustainably.’
UK Economic Calendar

Until then, data prints coming out of the UK may sway GBP/USD as the Retail Sales report is anticipated to show a rebound in household consumption, and a positive development may fuel the recent recovery in GBP/USD as it raises the BoE’s scope to further combat inflation.
However, a weaker-than-expected UK Retail Sales report may drag on GBP/USD as it puts pressure on the BoE to pursue a less restrictive policy, and the British Pound may struggle to hold its ground against its US counterpart as the Federal Open Market Committee (FOMC) seems to be in no rush to switch gears.
With that said, the recent rebound in GBP/USD could be temporary as the 50-Day SMA (1.2643) develops a negative slope, but the Relative Strength Index (RSI) may show the bearish momentum abating if it continues to move away from oversold territory.
GBP/USD Price Chart –Daily

Chart Prepared by David Song, Strategist; GBP/USD on TradingView
- GBP/USD extends the rebound from the monthly low (1.2406) to keep the Relative Strength Index (RSI) above 30, and the oscillator may show the bearish momentum abating if it continues to move away from oversold territory.
- Need a close above 1.2470 (50% Fibonacci retracement) to bring 1.2630 (38.2% Fibonacci retracement) back on the radar, with the next area of interest comes in around 1.2710 (23.6% Fibonacci extension), which largely aligns with the monthly high (1.2710).
- Nevertheless, the recent rebound in GBP/USD could be temporary as the 50-Day SMA (1.2643) develops a negative slope, and failure to defend the monthly low (1.2406) may push GBP/USD towards 1.2390 (38.2% Fibonacci extension), with the next region of interest coming in around 1.2300 (50% Fibonacci retracement) to 1.2320 (61.8% Fibonacci retracement).
Additional Market Outlooks
US Dollar Forecast: AUD/USD Takes Out February Low
US Dollar Forecast: USD/JPY Rally Eyes June 1990 High
--- Written by David Song, Strategist
Follow on Twitter at @DavidJSong


