US Dollar Outlook: GBP/USD
GBP/USD rallies to a fresh yearly high (1.2949) as the US Consumer Price Index (CPI) reveals slowing inflation, with the Relative Strength Index (RSI) flirting with overbought territory as the exchange rate breaks out of the range bound price action from earlier this week.
US Dollar Forecast: GBP/USD Rally Pushes RSI Towards Overbought Zone
GBP/USD initiates a series of higher highs and lows as both the headline and core US CPI narrow in June, and the RSI may show the bullish momentum gathering pace should the oscillator push above 70 for the second time this year.
Join David Song for the Weekly Fundamental Market Outlook webinar. David provides a market overview and takes questions in real-time. Register Here
It remains to be seen if the Federal Reserve will respond to the CPI report as Chairman Jerome Powell endorses a data-dependent approach in front of Congress, but speculation surrounding Fed policy may continue to sway GBP/USD as the central bank ‘projects that the appropriate level of the federal funds rate will be 5.1 percent at the end of this year.’
CME FedWatch Tool

Source: CME
In turn, the CME FedWatch Tool now reflects a greater than 80% probability for a rate-cut in September after showing 47% a month ago, and the US Dollar may continue to face headwinds ahead of the quarterly meeting amid the renewed progress in bringing down inflation towards the Fed’s 2% target.
US Economic Calendar

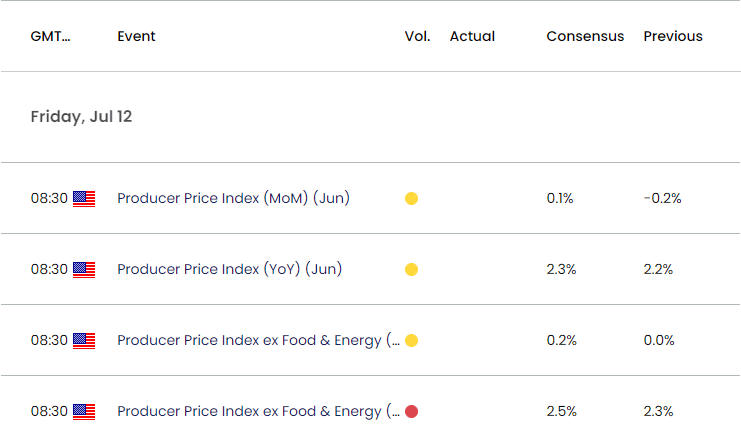
Nevertheless, the US Producer Price Index (PPI) may keep the Federal Open Market Committee (FOMC) on the sidelines as headline reading is expected to increase to 2.3% from 2.2% in May, with the core rate expected to show a similar dynamic as the gauge is seen widening to 2.5% from 2.3% during the same period.
A pickup in factory-gate prices may drag on GBP/USD as it raises the Fed’s scope to keep US interest rates higher for longer, but a softer-than-expected PPI report may keep the exchange rate afloat as it fuels speculation for a rate-cut in 2024.
With that said, a further advance in GBP/USD may push the Relative Strength Index (RSI) above 70 for the second time this year, but the oscillator may show the bullish momentum abating if it struggles to push into overbought territory.
GBP/USD Price Chart –Daily

Chart Prepared by David Song, Strategist; GBP/USD on TradingView
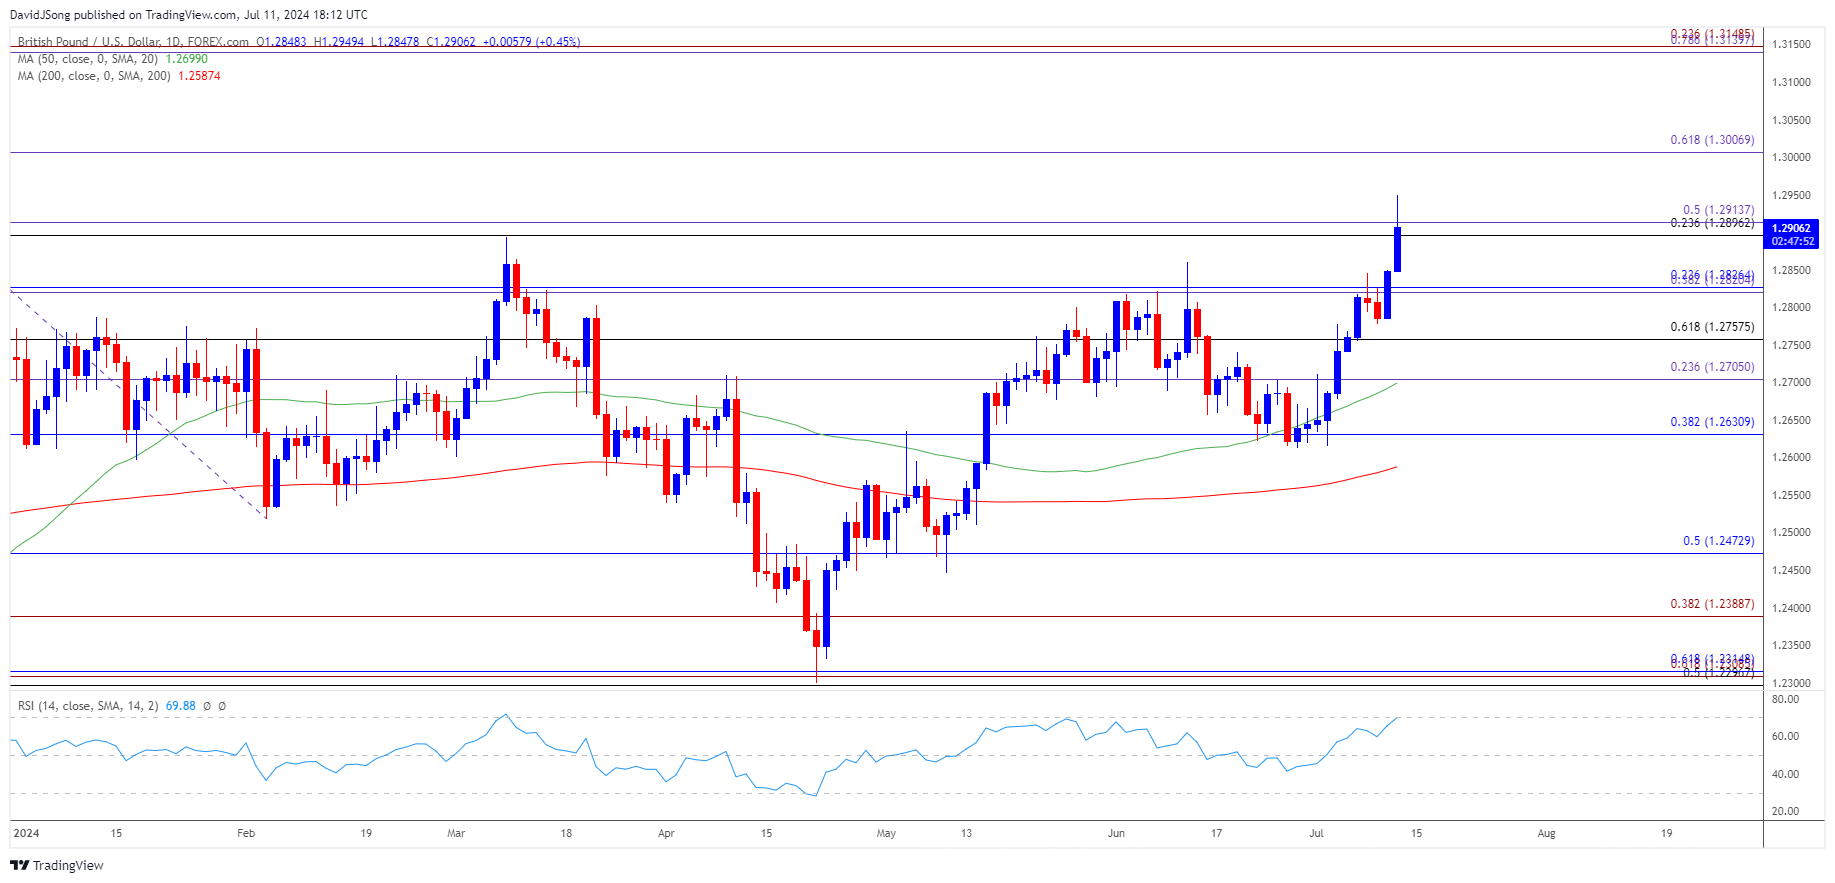
- Keep in mind, the recent rally in GBP/USD materialized following the failed attempt to test the June low (1.2613), with the Relative Strength Index (RSI) flirting with overbought territory as the exchange rate trades to a fresh yearly high (1.2949).
- The RSI may show the bullish momentum gathering pace should it push into overbought territory, with a close above the 1.2900 (23.6% Fibonacci retracement) to 1.2910 (50% Fibonacci extension) region bringing 1.3010 (61.8% Fibonacci extension) on the radar.
- Next area of interest comes in around 1.3140 (78.6% Fibonacci extension) to 1.3150 (23.6% Fibonacci extension) but the RSI may show the bullish momentum abating if it struggles to push into overbought territory.
- Failure to close above the 1.2900 (23.6% Fibonacci retracement) to 1.2910 (50% Fibonacci extension) region may push GBP/USD back towards the 1.2760 (61.8% Fibonacci retracement) to 1.2830 (23.6% Fibonacci retracement) zone, with the next area of interest coming in around 1.2710 (23.6% Fibonacci extension).
Additional Market Outlooks
USD/JPY Forecast: RSI Approaches Overbought Territory Again
US Dollar Forecast: USD/CAD Defends May Low Ahead of Fed Testimony
--- Written by David Song, Strategist
Follow on Twitter at @DavidJSong


