US Dollar Outlook: GBP/USD
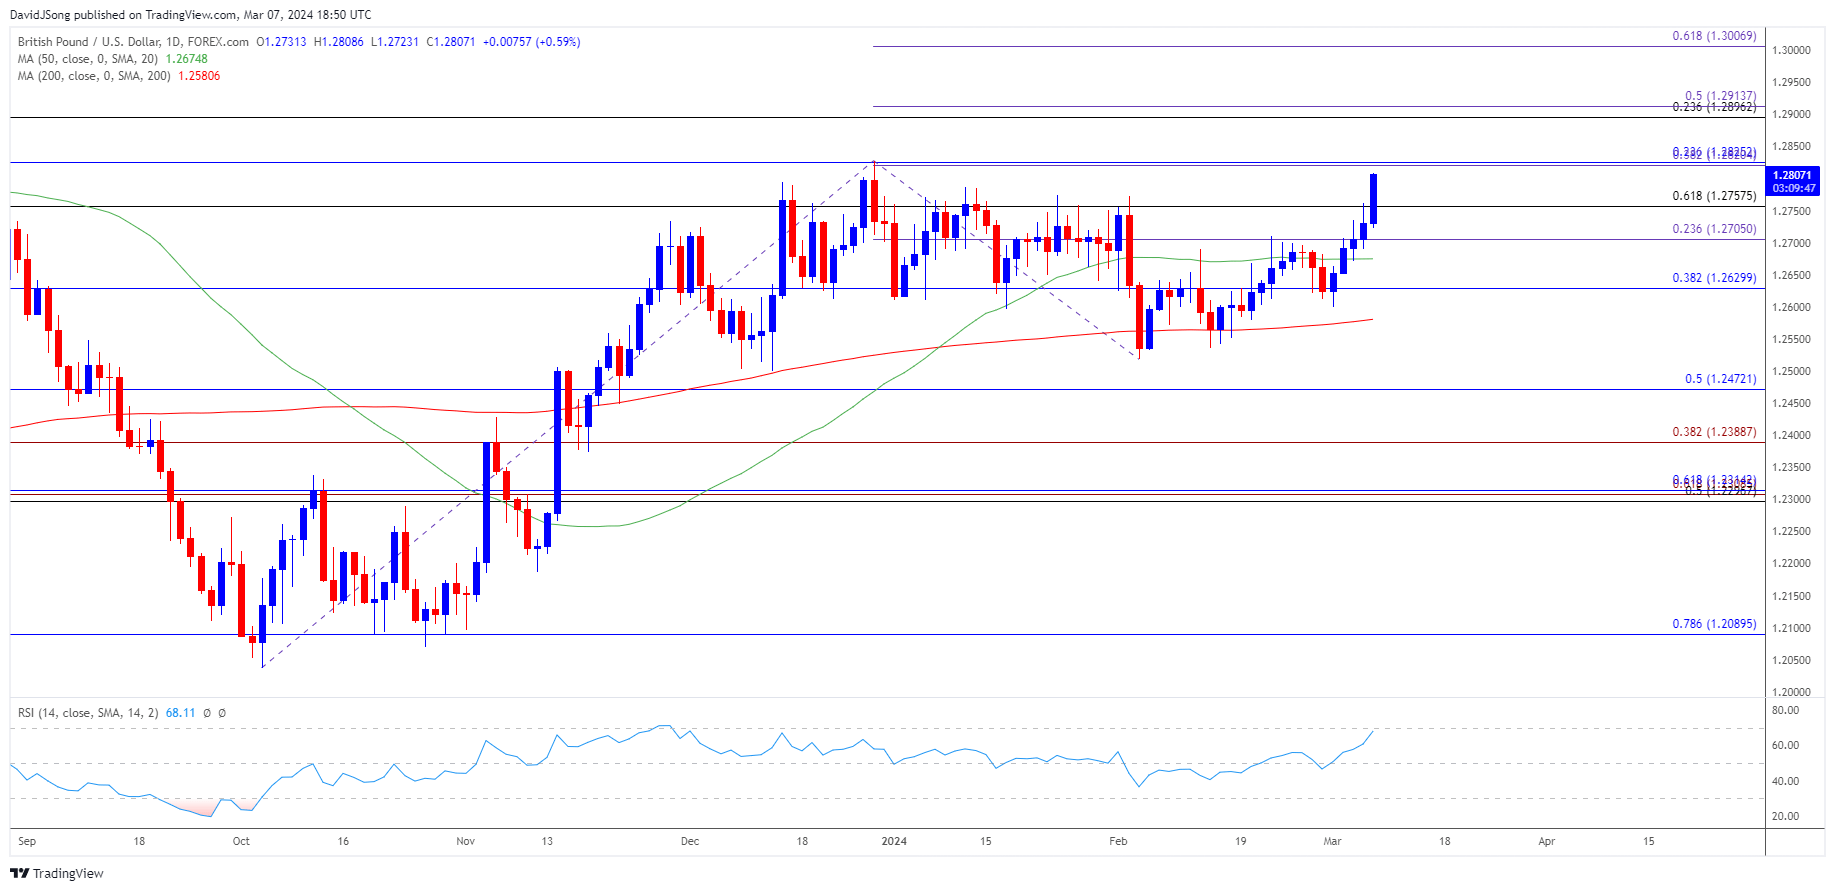
GBP/USD clears the January high (1.2787) as it extends the series of higher highs and lows from the start of the month, but the exchange rate may track the flattening slope in the 50-Day SMA (1.2675) if it continues to hold within the December range.
US Dollar Forecast: GBP/USD Rally Eyes December High
GBP/USD trades to a fresh yearly high (1.2798) as it extends the advance following the semi-annual testimony from Federal Reserve Chairman Jerome Powell, and the exchange rate may attempt to break out of the range bound price action carried over from last year should it clear the December high (1.2828).
Join David Song for the Weekly Fundamental Market Outlook webinar. David provides a market overview and takes questions in real-time. Register Here
US Economic Calendar

However, the US Non-Farm Payrolls (NFP) report may sway foreign exchange markets as the update is anticipated to show the economy adding 200K jobs in February, and another rise in employment may curb the recent advance in GBP/USD as it encourages the Fed to retain a restrictive policy.
At the same time, a weaker-than-expected NFP print may produce headwinds for the Greenback as it puts pressure on the Federal Open Market Committee (FOMC) to reduce US interest rates sooner rather than later, and GBP/USD may break out of the range bound price action carried over from last year if it clears the December high (1.2828).
With that said, GBP/USD may continue to trade to fresh yearly highs as it extends the series of higher highs and lows from the start of the month, but the exchange rate may track the flattening slope in the 50-Day SMA (1.2675) if it continues to hold within the December range.
GBP/USD Price Chart –Daily

Chart Prepared by David Song, Strategist; GBP/USD on TradingView
- GBP/USD trades to a fresh yearly high (1.2798) as it stages a five-day rally, and the exchange rate may test the December high (1.2828) as it extends the series of higher highs and lows from the start of the month.
- A break/close above the 1.2760 (61.8% Fibonacci retracement) to 1.2830 (23.6% Fibonacci retracement) region opens up the 1.2900 (23.6% Fibonacci retracement) to 1.2910 (50% Fibonacci extension) area, and a move above 70 in the Relative Strength Index (RSI) is likely to be accompanied by a further advance in GBP/USD like the price action from last year.
- Next region of interest comes in around 1.3010 (61.8% Fibonacci extension), but failure to clear the December high (1.2828) may keep GBP/USD within a defined range, with a move below 1.2710 (23.6% Fibonacci extension) opening up 1.2630 (38.2% Fibonacci retracement).
Additional Market Outlooks
US Dollar Forecast: AUD/USD Faces Negative Slope in 50-Day SMA
US Dollar Forecast: USD/CAD Trades in Ascending Channel Ahead of BoC
--- Written by David Song, Strategist
Follow on Twitter at @DavidJSong


