British Pound Outlook: GBP/USD
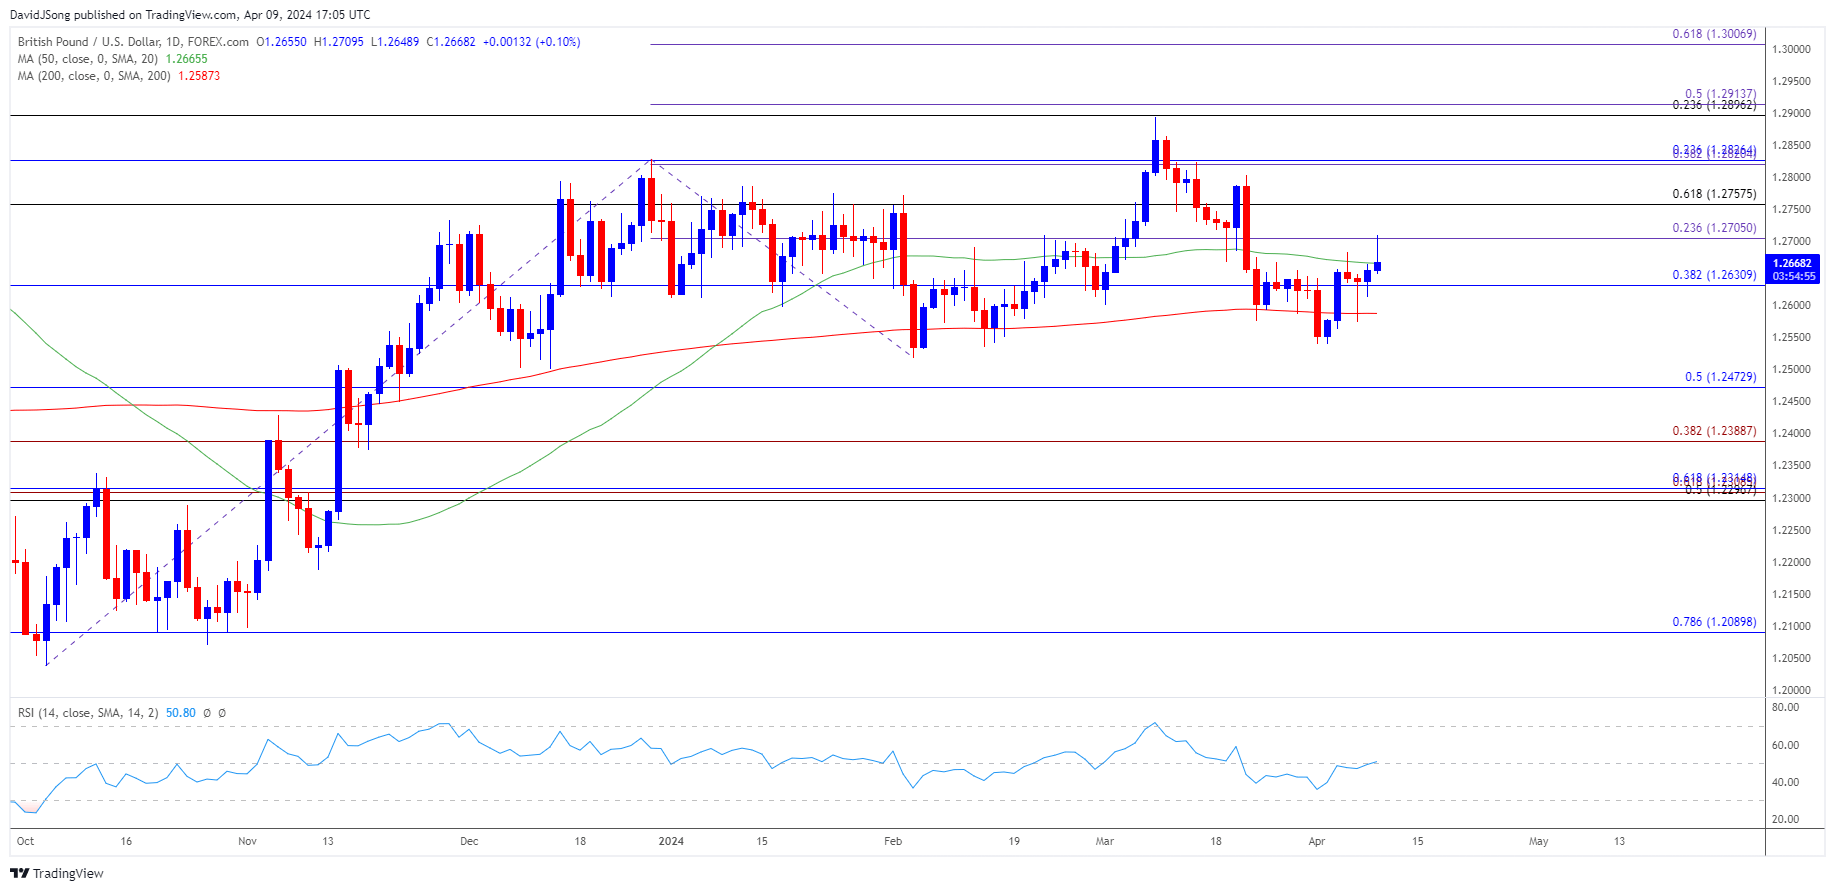
GBP/USD bounces along the 50-Day SMA (1.2666) after pushing above the opening range for April, and the exchange rate may further retrace the decline from the March high (1.2894) as it carves a series of higher highs and lows.
US Dollar Forecast: GBP/USD Pushes Above Opening Range for April
GBP/USD seems to have reversed ahead of the February low (1.2518) as it climbs to a fresh monthly high (1.2704), but the exchange rate may track the flattening slope in the moving average as Bank of England (BoE) officials no longer vote for higher interest rates.
Join David Song for the Weekly Fundamental Market Outlook webinar. David provides a market overview and takes questions in real-time. Register Here
At the same time, the Federal Reserve appears to be in no rush to switch gears as the central bank ‘does not expect it will be appropriate to reduce the target range until it has gained greater confidence that inflation is moving sustainably down toward 2 percent,’ and GBP/USD may face range bound conditions ahead of the Federal Open Market Committee (FOMC) interest rate decision on May 1 as Chairman Jerome Powell and Co. carry out a wait-and-see approach in managing monetary policy.
US Economic Calendar

In turn, the update to the US Consumer Price Index (CPI) may keep the FOMC on the sidelines if the figures reflect persistent price growth, and ongoing signs of sticky inflation may spark a bullish reaction in the Greenback as it puts pressure on the Fed to retain a restrictive policy.
At the same time, a softer-than-expected CPI report may drag on the US Dollar as it raises the Fed’s scope to implement lower interest rates, and GBP/USD may extend the advance from the start of the week as it carves a series of higher highs and lows.
With that said, GBP/USD attempt to further retrace the decline from the March high (1.2894) as it bounces back ahead of the February low (1.2518), but the exchange rate may face range bound conditions if it tracks the flattening slope in the 50-Day SMA (1.2666).
GBP/USD Price Chart –Daily

Chart Prepared by David Song, Strategist; GBP/USD on TradingView
- GBP/USD extends the advance from the start of the week to clear the opening range for April, with a close above 1.2710 (23.6% Fibonacci extension) raising the scope for a move towards the 1.2760 (61.8% Fibonacci retracement) t0 1.2830 (23.6% Fibonacci retracement) region.
- Next area of interest comes in around the March high (1.2894), with a break/close above the 1.2900 (23.6% Fibonacci retracement) to 1.2910 (50% Fibonacci extension) area opening up 1.3010 (61.8% Fibonacci extension).
- However, GBP/USD may face range bound conditions if it tracks the flattening slope in the 50-Day SMA (1.2666), with a move below 1.2630 (38.2% Fibonacci retracement) bringing the monthly low (1.2540) on the radar.
Additional Market Outlooks
USD/JPY Susceptible to Further Attempts to Test July 1990 High
EUR/USD Bounces Along 50-Day SMA amid Post-NFP Rebound
--- Written by David Song, Strategist
Follow on Twitter at @DavidJSong


