British Pound Outlook: GBP/USD
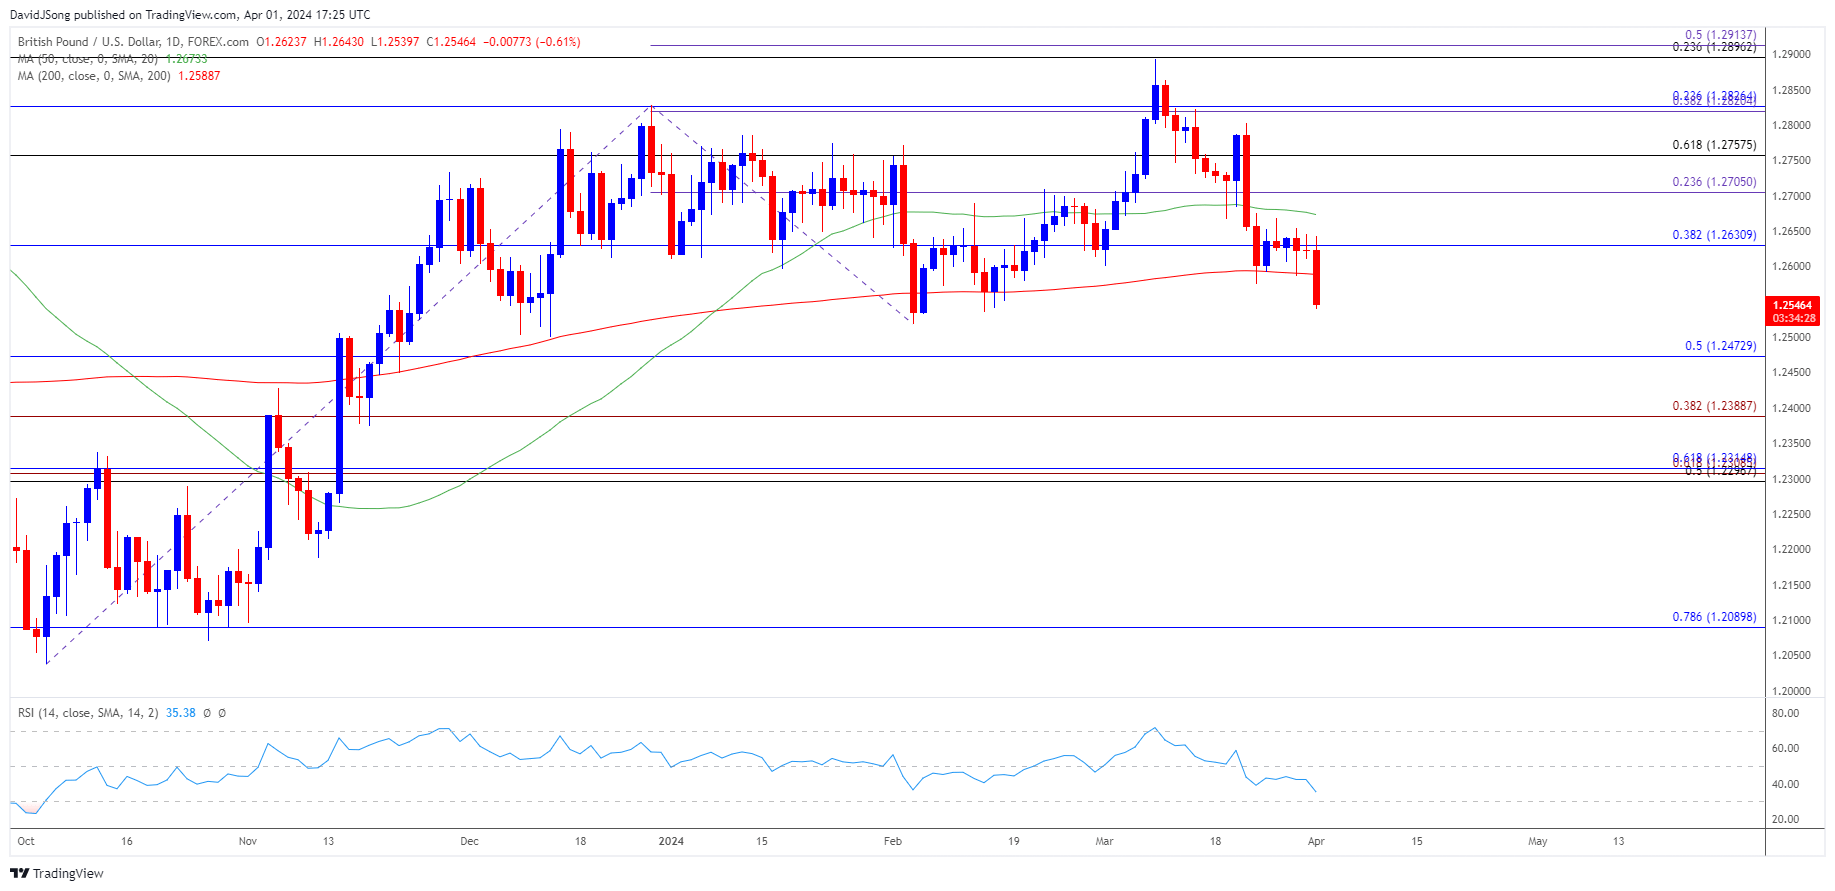
GBP/USD snaps the range bound price action from last week as the US ISM Manufacturing survey prints at 50.3 in March versus forecasts for a 48.4 reading, and the exchange rate may attempt to test the yearly low (1.2518) as the Relative Strength Index (RSI) falls to its lowest level since October.
US Dollar Forecast: GBP/USD Clears March Low Ahead of US NFP Report
GBP/USD clears the March low (1.2575) after struggling to retrace the decline following the Bank of England (BoE) interest rate decision, and the exchange rate may no longer track the flattening slope in the 50-Day SMA (1.2673) even though the Federal Reserve continues to forecast lower interest rates in 2024.
Join David Song for the Weekly Fundamental Market Outlook webinar. David provides a market overview and takes questions in real-time. Register Here
However, the Federal Open Market Committee (FOMC) may have little choice but to keep US interest rate higher for longer as the core US Personal Consumption Expenditure (PCE) Price Index, the Fed’s preferred gauge for inflation, holds steady at 2.8% per annum in February.
US Economic Calendar

At the same time, the update to the Non-Farm Payrolls (NFP) report may push the FOMC to retain a restrictive policy as the economy is anticipated to add 200K jobs in March while the Unemployment Rate is expected to hold steady at 3.9% during the same period.
Persistent signs of a robust labor market may generate a bullish reaction in the Greenback as it raises the Fed’s scope to further combat inflation, but a weaker-than-expected NFP print may curb the recent weakness in GBP/USD as it fuels speculation for a looming FOMC rate cut.
With that said, the opening range for April is in focus as GBP/USD clears the March low (1.2575), and the exchange rate may attempt to test the yearly low (1.2518) as the Relative Strength Index (RSI) falls to its lowest level since October.
GBP/USD Price Chart –Daily

Chart Prepared by David Song, Strategist; GBP/USD on TradingView
- GBP/USD snaps the range bound price action from last week after struggling to trade back above the 50-Day SMA (1.2673), and the exchange rate may no longer track the flattening slope in the moving average as the Relative Strength Index (RSI) falls to its lowest level since October.
- Failure to defend the February low (1.2518) may lead to a test of the December low (1.2500), with the next area of interest coming in around 1.2470 (50% Fibonacci retracement).
- Nevertheless, GBP/USD may attempt to retrace the recent selloff if it defends the February low (1.2518), with a breach above the moving average bringing 1.2710 (23.6% Fibonacci extension) on the radar.
Additional Market Outlooks
US Dollar Forecast: USD/JPY Opening Range for April in Focus
US Dollar Forecast: EUR/USD Defends March Opening Range for Now
--- Written by David Song, Strategist
Follow on Twitter at @DavidJSong


