US Dollar Outlook: GBP/USD
GBP/USD clears the April high (1.2710) ahead of the update to the UK Consumer Price Index (CPI), and the exchange rate may attempt to further retrace the decline from the March high (1.2894) amid the limited response to the negative slope in the 50-Day SMA (1.2585).
US Dollar Forecast: GBP/USD Clears April High Ahead of UK CPI
GBP/USD extends the series of higher highs and lows following the downtick in the US CPI to register a fresh monthly high (1.2719), and it remains to be seen if the Federal Reserve will respond to the data print as Governor Michael Barr acknowledges that ‘inflation readings in the first quarter of this year were disappointing’ while speaking at an event hosted by the Atlanta Fed.
Join David Song for the Weekly Fundamental Market Outlook webinar. David provides a market overview and takes questions in real-time. Register Here
Barr goes onto say that the Federal Open Market Committee (FOMC) ‘will need to allow our restrictive policy some further time to continue to do its work,’ and the comments suggest the FOMC will keep US interest rates higher for longer amid the lack of progress in bringing down inflation to the 2% target.
UK Economic Calendar

Meanwhile, the update to the UK CPI may foster a greater dissent within the Bank of England (BoE) as both the headline and core reading are expected to show a meaningful slowdown in April, and evidence of easing price growth may curb the recent advance in GBP/USD as Swati Dhingra and Dave Ramsden push for a rate cut.
However, a higher-than-expected CPI report may lead to another 7 to 2 split within the Monetary Policy Committee (MPC) insists that ‘monetary policy would need to remain restrictive for sufficiently long to return inflation to the 2% target,’ and signs of persistent UK inflation may keep GBP/USD afloat as it puts pressure on the BoE to retain a restrictive policy.
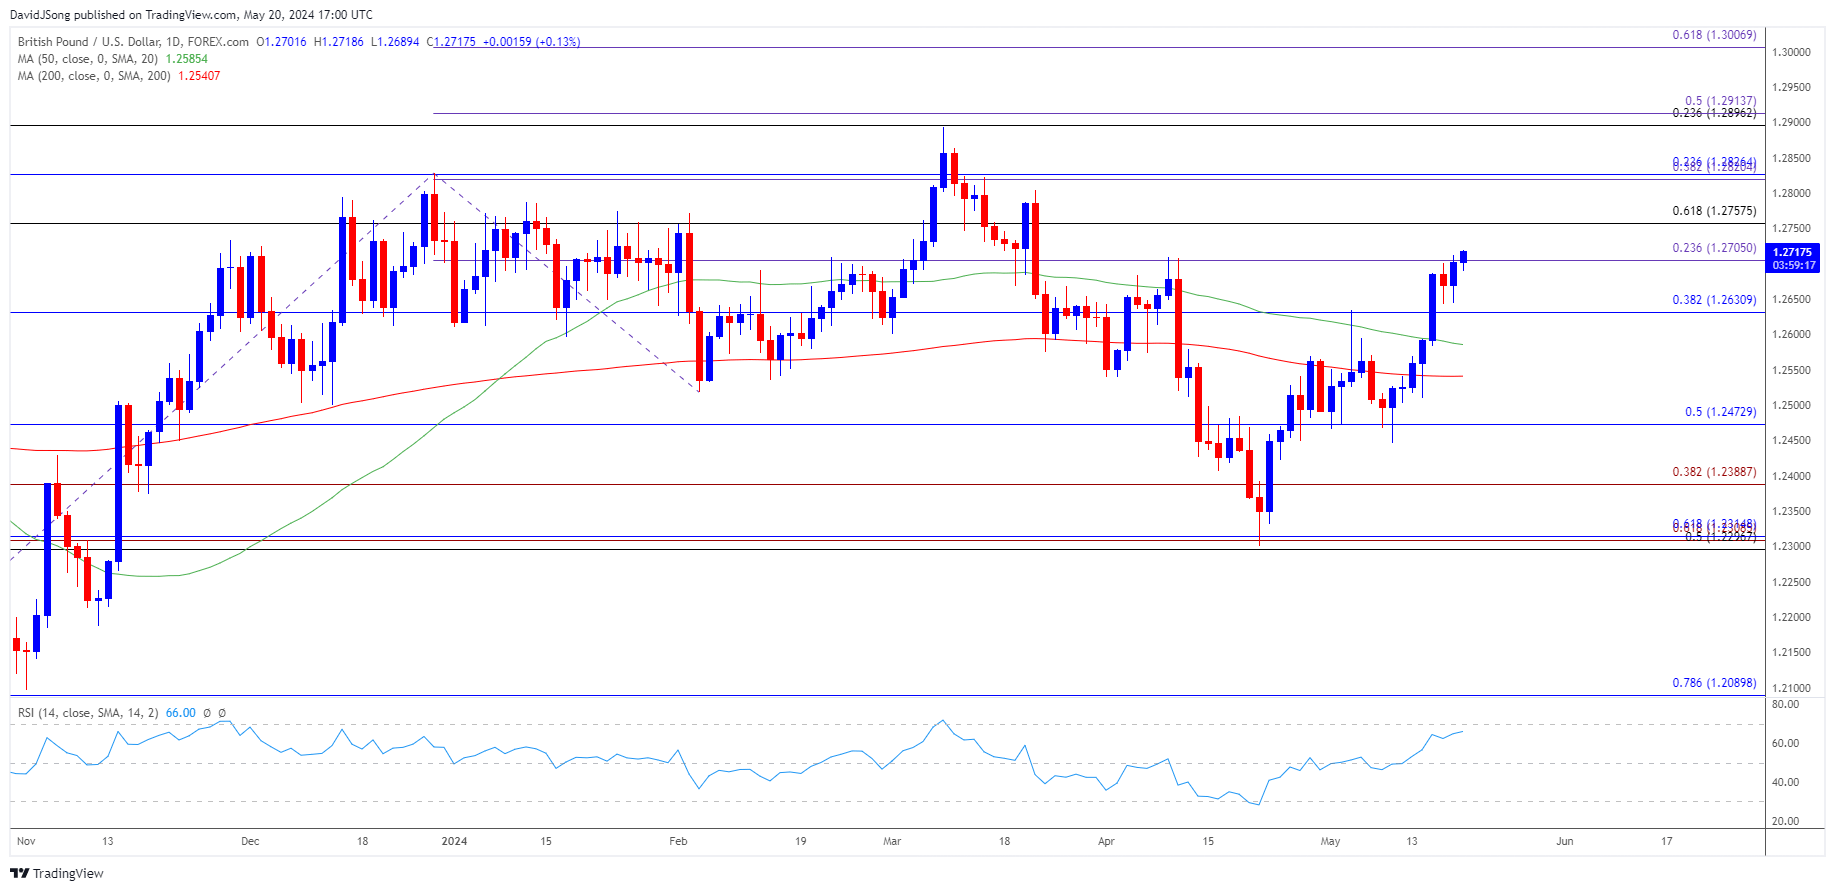
With that said, GBP/USD may continue to trade to fresh monthly highs amid the amid the limited response to the negative slope in the 50-Day SMA (1.2585), but the exchange rate may struggle to retrace the decline from the March high (1.2894) should the Relative Strength Index (RSI) continue to hold below 70.
GBP/USD Price Chart –Daily

Chart Prepared by David Song, Strategist; GBP/USD on TradingView
- GBP/USD pushed above the monthly opening range to clear the April high (1.2710), with a breach above the 1.2760 (61.8% Fibonacci retracement) to 1.2830 (23.6% Fibonacci retracement) region bringing the March high (1.2894) on the radar.
- A break/close the 1.2900 (23.6% Fibonacci retracement) to 1.2910 (50% Fibonacci extension) area opens up 1.3010 (61.8% Fibonacci extension), but lack of momentum to push above the 1.2760 (61.8% Fibonacci retracement) to 1.2830 (23.6% Fibonacci retracement) region may keep the Relative Strength Index (RSI) out of overbought territory.
- Failure to hold above 1.2710 (23.6% Fibonacci extension) may push GBP/USD back towards 1.2630 (38.2% Fibonacci retracement), with a break/close below 1.2470 (50% Fibonacci retracement) opening up the monthly low (1.2446).
Additional Market Outlooks
US Dollar Forecast: EUR/USD Pullback Keeps RSI Out of Overbought Zone
US Dollar Forecast: AUD/USD Rally Pushes RSI Towards Overbought Zone
--- Written by David Song, Strategist
Follow on Twitter at @DavidJSong


