US Dollar Outlook: GBP/USD
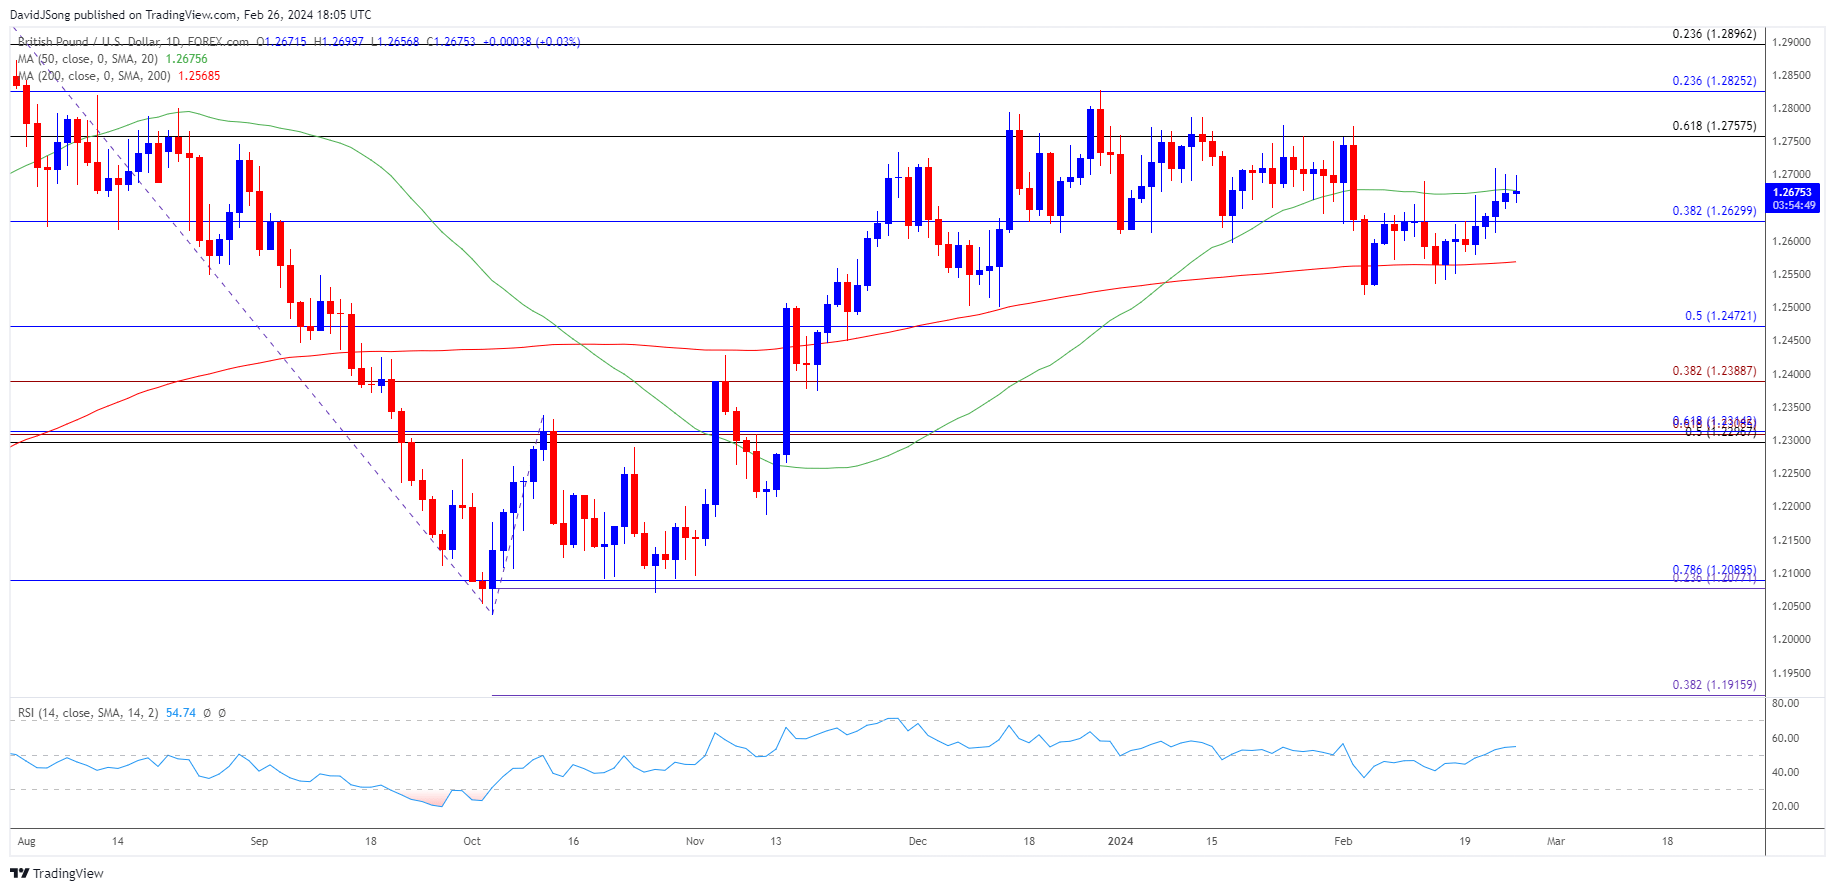
GBP/USD attempts to trade back above the 50-Day SMA (1.2676) following the four-day rally from last week, but the exchange rate may track the flattening slope in the moving average should it struggle to test the monthly high (1.2772).
US Dollar Forecast: GBP/USD Attempts to Trade Back Above 50-Day SMA
GBP/USD retraces the decline following the stronger-than-expected US Consumer Price Index (CPI) after failing to take out the monthly low (1.2518), and the exchange rate may stage a further advance should it push above the opening range for February.
Join David Song for the Weekly Fundamental Market Outlook webinar. David provides a market overview and takes questions in real-time. Register Here
Nevertheless, the update to the US Personal Consumption Expenditure (PCE) Price Index may sway GBP/USD as the Federal Reserve endorses a data dependent approach in managing monetary policy, and another downtick in the core PCE, the Fed’s preferred gauge for inflation, may keep GBP/USD afloat as the index is expected to narrow to 2.8% in January from 2.9% per annum the month prior.
US Economic Calendar

Evidence of slowing price growth may push the Federal Open Market Committee (FOMC) to gradually adjust the forward guidance for monetary policy as officials forecast lower interest rates for 2024, but a higher-than-expected core PCE print may drag on GBP/USD as it puts pressure on the FOMC to keep US interest rates higher for longer.
With that said, GBP/USD may further retrace the decline from the monthly high (1.2772) as it attempts to trade above the 50-Day SMA (1.2676), but the exchange rate may consolidate over the coming days if it struggles to hold above the moving average.
GBP/USD Price Chart –Daily

Chart Prepared by David Song, Strategist; GBP/USD on TradingView
- GBP/USD may further retrace the decline from the monthly high (1.2772) as it attempts to trade above the 50-Day SMA (1.2676), with a breach above the January high (1.2787) raising the scope for a test of the December high (1.2828).
- A break/close above the 1.2760 (61.8% Fibonacci retracement) to 1.2830 (23.6% Fibonacci retracement) opens up 1.2900 (23.6% Fibonacci retracement), but GBP/USD may track the flattening slope in the moving average if it struggles to retrace the decline from the monthly high (1.2772).
- Lack of momentum to hold above 1.2630 (38.2% Fibonacci retracement) may push GBP/USD towards the monthly low (1.2518), with a breach below the December low (1.2500) bringing 1.2470 (50% Fibonacci retracement) on the radar.
Additional Market Outlooks
US Dollar Forecast: USD/CAD Coils Above 50-Day SMA
US Dollar Forecast: USD/JPY Rate Eyes Monthly High
--- Written by David Song, Strategist
Follow on Twitter at @DavidJSong


