US Dollar Outlook: EUR/USD
EUR/USD appears to have reversed ahead of the monthly low (1.0912) as it clears the opening range for August, and the exchange rate may track the positive slope in the 50-Day SMA (1.0957) amid the string of failed attempts to close below the moving average.
US Dollar Forecast: EUR/USD Clears August Opening Range
EUR/USD registers a fresh monthly high (1.1065) as the US Consumer Price Index (CPI) prints at 3.2% for July versus forecasts for a 3.3% print, and it remains to be seen if the data print will sway the Federal Reserve as the core rate unexpectedly narrows to 4.7% from 4.8% per annum the month prior.
Join David Song for the Weekly Fundamental Market Outlook webinar. David provides a market overview and takes questions in real-time. Register Here
US Economic Calendar

As a result, market participants may pay increased attention to the US Producer Price Index (PPI) as the core reading is seen narrowing to 2.3% from 2.4% in June, and further signs of slowing inflation may produce headwinds for the Greenback as it encourages the Federal Open Market Committee (FOMC) to adjust the forward guidance for monetary policy.

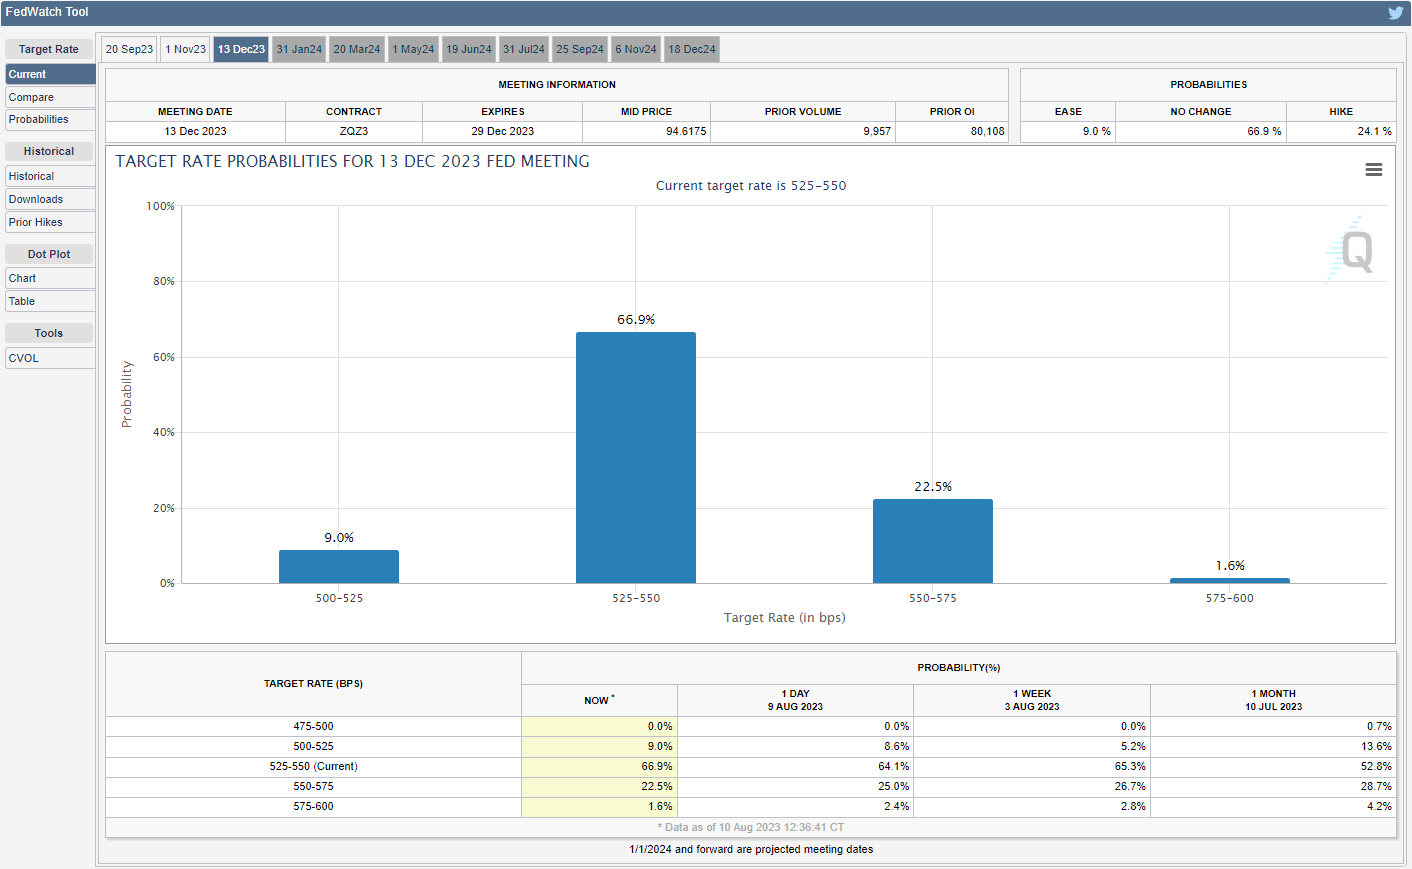
Source: CME
In turn, EUR/USD may continue to retrace the decline from the July high (1.1276) as the CME FedWatch Tool reflects a greater than 70% probability of seeing US interest rates unchanged over the remainder of the year, but a stronger-than-expected PPI print may generate a bullish reaction in the Greenback as it puts pressure on the FOMC to further combat inflation.
With that said, data prints coming out of the US may continue to sway EUR/USD ahead of the Fed rate decision on September 20 amid speculation for a looming change in regime, but the exchange rate may track the positive slope in the 50-Day SMA (1.0957) as it clears the opening range for August.
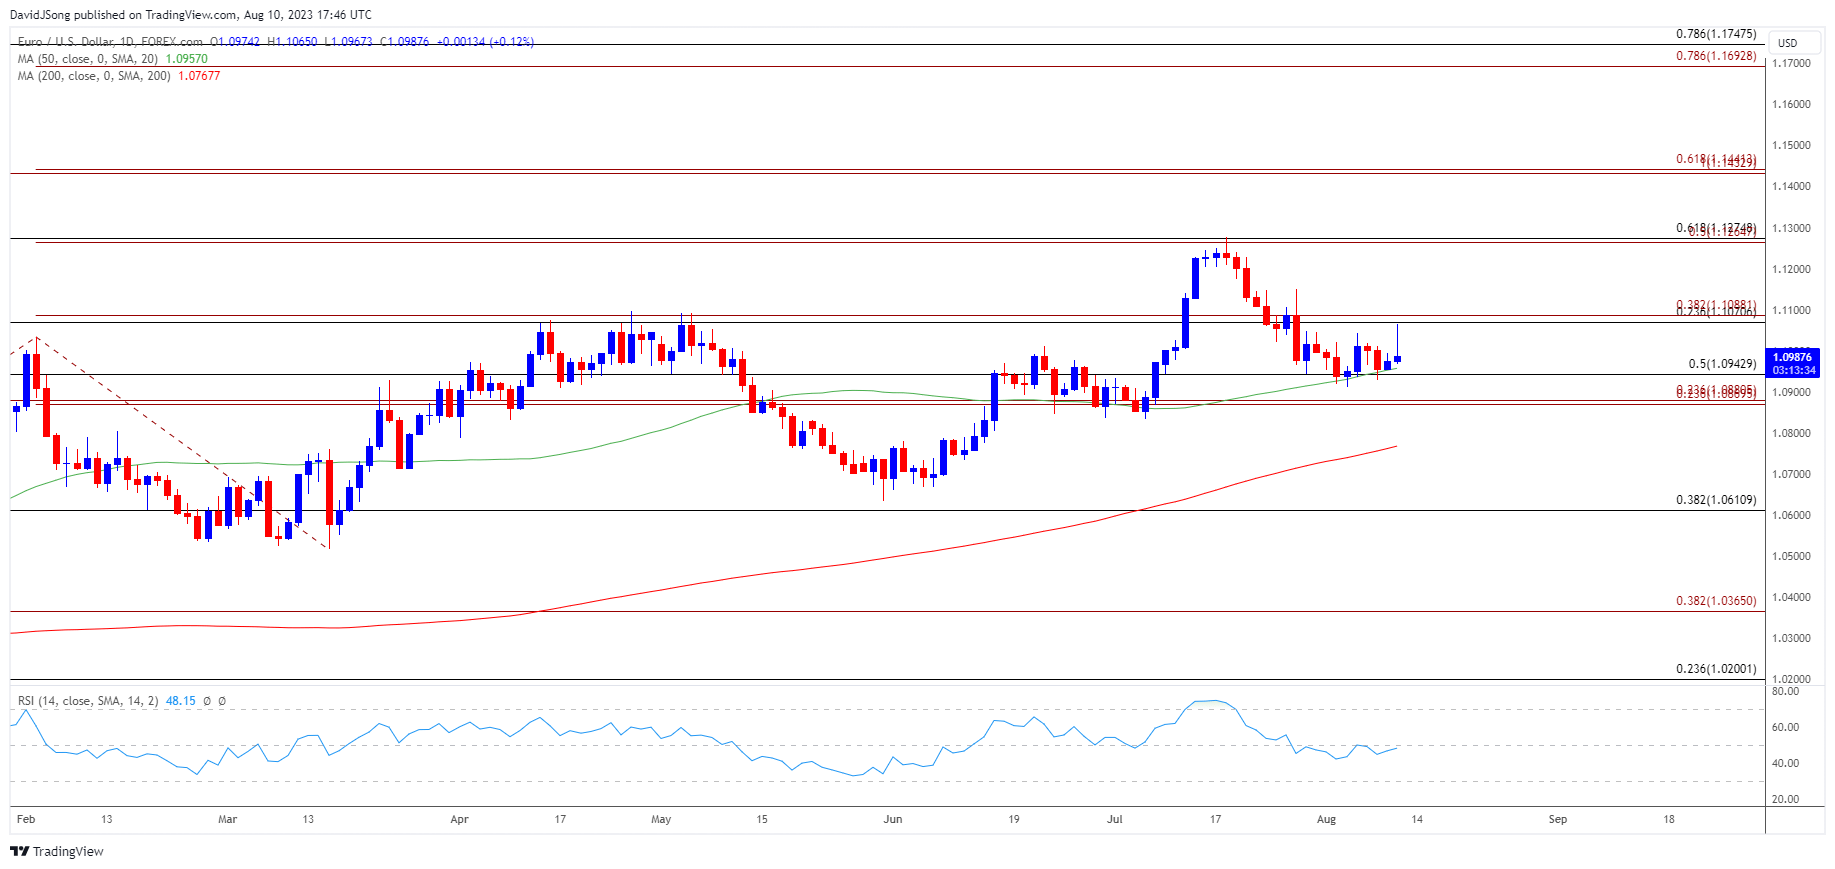
EUR/USD Chart – Daily

Chart Prepared by David Song, Strategist; EUR/USD on TradingView
- EUR/USD appears to have reversed ahead of the monthly low (1.0912) as it clears the opening range for August, with the exchange rate initiating a series of higher highs and lows following the failed attempts to close below the 50-Day SMA (1.0957).
- EUR/USD may track the positive slope in the moving average as it registers a fresh monthly high (1.1065), with a break/close above the 1.1070 (23.6% Fibonacci retracement) to 1.1090 (38.2% Fibonacci extension) area bringing the 1.1270 (50% Fibonacci extension) to 1.1280 (61.8% Fibonacci retracement) zone back on the radar.
- However, failure to break/close above the 1.1070 (23.6% Fibonacci retracement) to 1.1090 (38.2% Fibonacci extension) area may keep EUR/USD within last month’s range, with a move below the 1.0880 (23.6% Fibonacci extension) to 1.0940 (50% Fibonacci retracement) region raising the scope for a test of the July low (1.0834).
Additional Market Outlooks
GBP/USD Susceptible to Break of August Opening Range
AUD/USD Rate Reaction to June Low in Focus
--- Written by David Song, Strategist
Follow on Twitter at @DavidJSong


