US Dollar Outlook: AUD/USD
AUD/USD carves a series of lower highs and lows after failing to clear the monthly high (0.6714), but the exchange rate may face range bound conditions ahead of the update to the US Personal Consumption Expenditure (PCE) Index as the 50-Day SMA (0.6552) no longer reflects a negative slope.
US Dollar Forecast: AUD/USD Vulnerable amid Failure to Clear May High
The recent rally in AUD/USD appears to have stalled ahead of the January high (0.6839) as it extends the decline following the Federal Open Market Committee (FOMC) Minutes, and the exchange rate may continue to give back the advance from the monthly low (0.6465) as the Federal Reserve appears to be in no rush to alter the course for monetary policy.
Join David Song for the Weekly Fundamental Market Outlook webinar. Register Here
It remains to be seen if the FOMC will respond to the recent developments coming out of the US economy as the Durable Goods Orders report shows a 0.7% rise in April versus forecasts for a 0.8% decline, and signs of a resilient economy may encourage Chairman Jerome Powell and Co. to retain a restrictive policy as inflation remains above the central bank’s 2% target.
US Economic Calendar

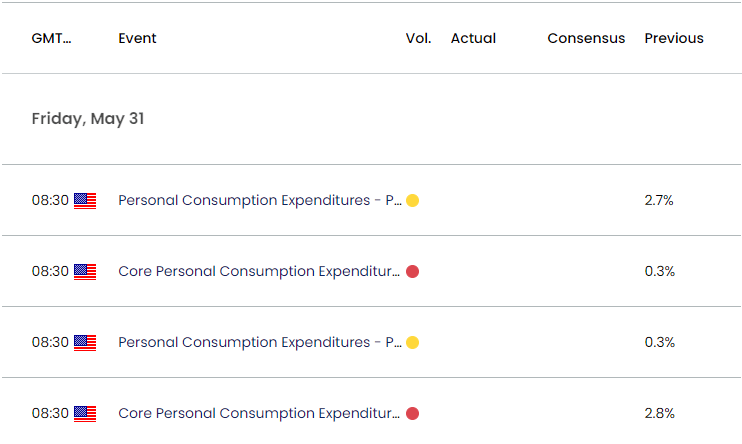
In turn, the PCE report, the Fed’s preferred gauge for inflation, may sway foreign exchange markets as the central bank carries out a data-dependent approach in managing monetary policy, and signs of persistent inflation may generate a bullish reaction in the Greenback as market participants scale back bets for a rate-cut in 2024.
At the same time, a downtick in the PCE index may drag on the Greenback as it raises the Fed’s scope to switch gears, and speculation for a looming change in regime may curb the recent decline in AUD/USD as market participants brace for lower US interest rates.
With that said, AUD/USD may face range bound conditions going into the end of the month if it snaps the recent series of lower highs and lows, but the exchange rate may further retrace the advance from the monthly low (0.6465) as the Relative Strength Index (RSI) reverses ahead of overbought territory.
AUD/USD Price Chart – Daily

Chart Prepared by David Song, Strategist; AUD/USD on TradingView
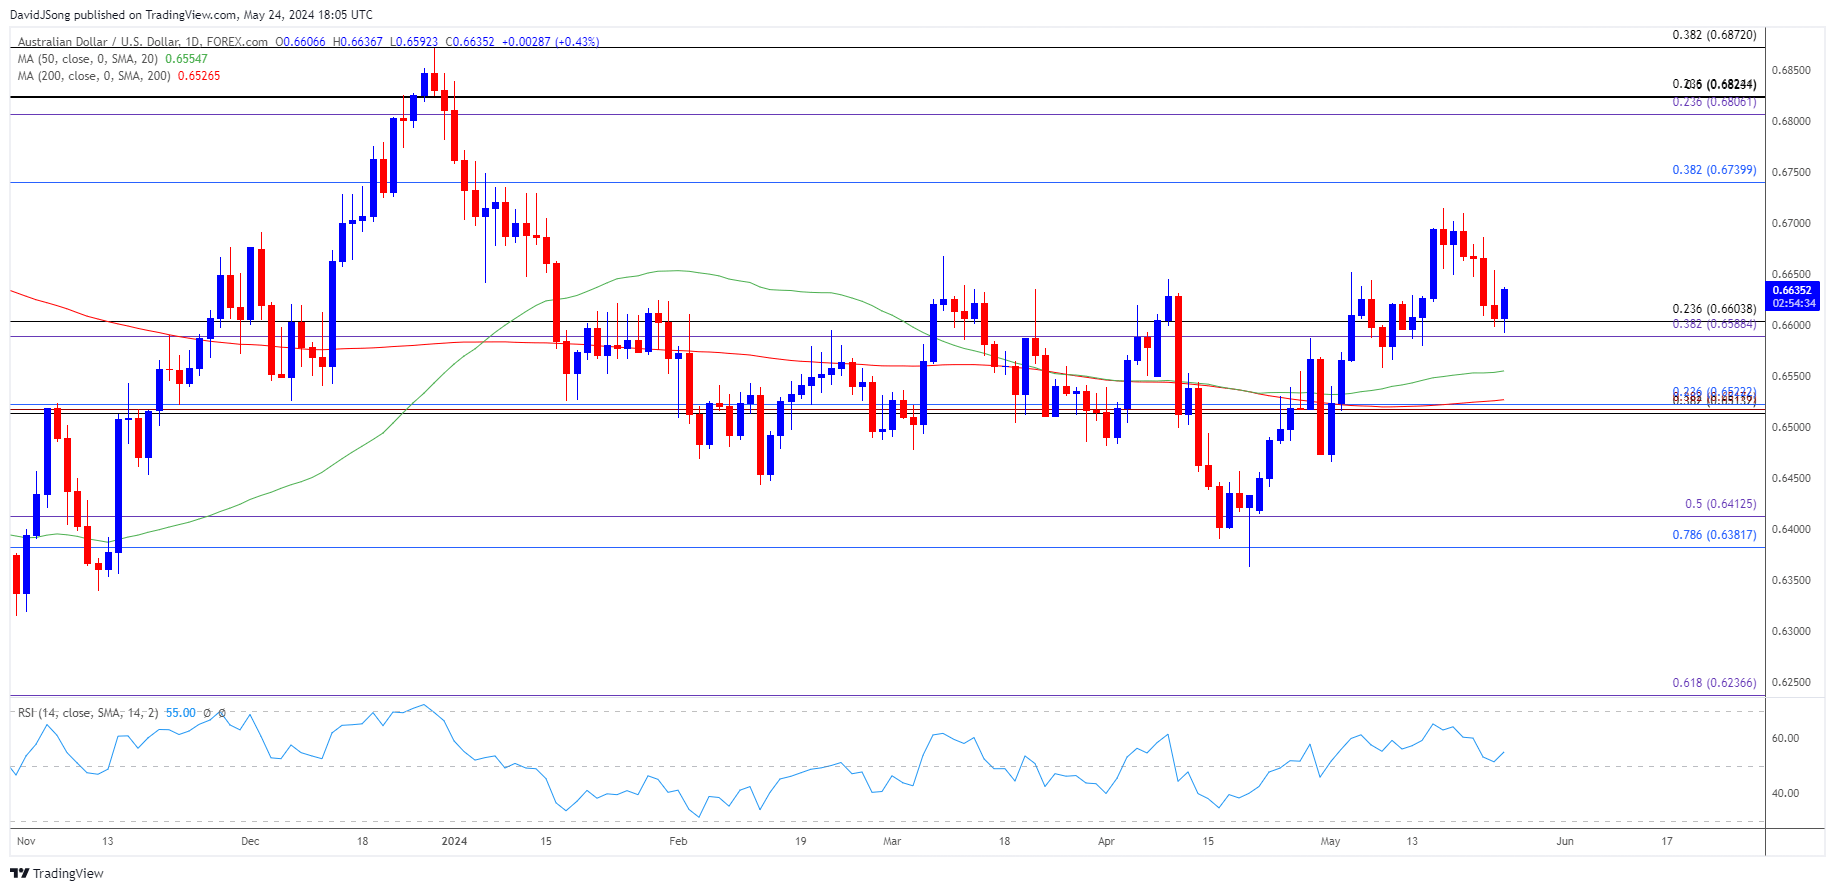
- The recent weakness in AUD/USD has kept the Relative Strength Index (RSI) below 70, with the exchange rate carving a series of lower highs and lows followed the failed attempt to clear the monthly high (0.6714).
- The RSI may continue to show the bullish momentum abating as it moves away from overbought territory but need a breach below the 0.6590 (38.2% Fibonacci extension) to 0.6600 (23.6% Fibonacci retracement) region to open up the 0.6510 (38.2% Fibonacci retracement) to 0.6520 (23.6% Fibonacci retracement) zone.
- Next area of interest comes in around the monthly low (0.6465), but AUD/USD may face range bound conditions as the 50-Day SMA (0.6555) no longer reflects a negative slope.
- Failure to break/close below the 0.6590 (38.2% Fibonacci extension) to 0.6600 (23.6% Fibonacci retracement) region may curb the bearish price series in AUD/USD, which could lead to another run at the monthly high (0.6714).
Additional Market Outlooks
US Dollar Forecast: USD/CAD Rebounds Within Ascending Channel
US Dollar Forecast: USD/JPY Rate Mirrors Weakness in US Yields
--- Written by David Song, Strategist
Follow on Twitter at @DavidJSong


