US Dollar Outlook: AUD/USD
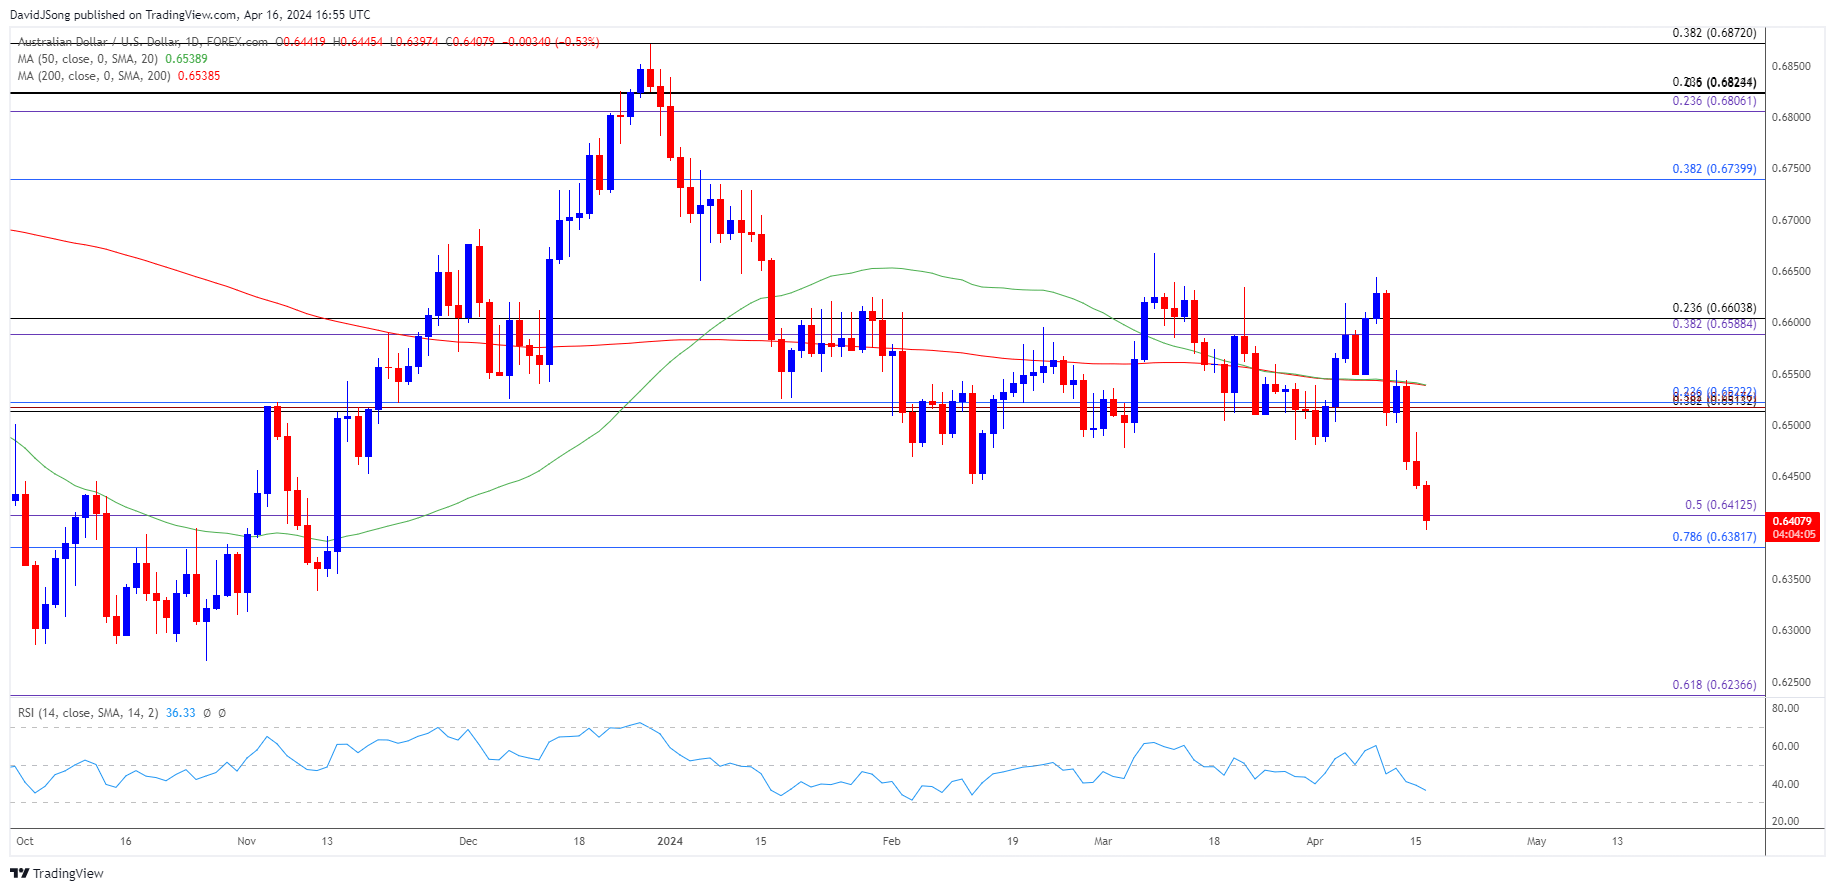
AUD/USD takes out the February low (0.6443) to register a fresh yearly low (0.6397), and the exchange rate may continue to give back the advance from the November low (0.6318) as it carves a series of lower highs and lows.
US Dollar Forecast: AUD/USD Takes Out February Low
AUD/USD remains under pressure following the stronger-than-expected US Retail Sales report, and the Greenback may continue to outperform against its Australian counterpart even as the Federal Reserve continues to forecast a less restrictive policy in 2024.
Join David Song for the Weekly Fundamental Market Outlook webinar. Register Here
However, the rise in private sector spending may keep the Federal Open Market Committee (FOMC) on the sidelines as the Consumer Price Index (CPI) indicates sticky inflation, and the central bank may keep US interest rates higher for longer in response to the ongoing expansion in economic activity.
Australia Economic Calendar

At the same time, the Reserve Bank of Australia (RBA) appears to be in no rush to switch gears as the ‘Board expects that it will be some time yet before inflation is sustainably in the target range,’ and the update the Australia’s Employment report may encourage Governor Michele Bullock and Co. to keep the cash rate target at 4.35% as the economy is anticipated to add 7.2K jobs in March.
Signs of a strong labor market may curb the recent decline in AUD/USD as it puts pressure on the RBA to further combat inflation, but a weaker-than-expected employment report may drag on the exchange rate as it raises the central bank’s scope to implement lower interest rates.
With that said, a further decline in AUD/USD may push the Relative Strength Index (RSI) into oversold territory as the oscillator sits at its lowest level since February, but lack of momentum to test the November low (0.6318) may curb the lower highs and lows in the exchange rate and keep the indicator above 30.
AUD/USD Price Chart – Daily

Chart Prepared by David Song, Strategist; AUD/USD on TradingView
- AUD/USD fails to defend the opening range for April as it extends the recent series of lower highs and lows, and the exchange rate may track the negative slope in the 50-Day SMA (0.6539) as it clears the February low (0.6443).
- A break/close below the 0.6380 (78.6% Fibonacci retracement) to 0.6410 (50% Fibonacci extension) region opens up the November low (0.6318), with the next area of interest coming in around the 2023 low (0.6270).
- Nevertheless, lack of momentum to break/close below the 0.6380 (78.6% Fibonacci retracement) to 0.6410 (50% Fibonacci extension) region may keep the Relative Strength Index (RSI) out of oversold territory, with a move above the 0.6510 (38.2% Fibonacci retracement) to 0.6520 (23.6% Fibonacci retracement) area raising the scope for a test of the moving average.
Additional Market Outlooks
US Dollar Forecast: USD/CAD Rallies Within Ascending Channel
US Dollar Forecast: GBP/USD Pushes Above Opening Range for April
--- Written by David Song, Strategist
Follow on Twitter at @DavidJSong


