US Dollar Outlook: AUD/USD
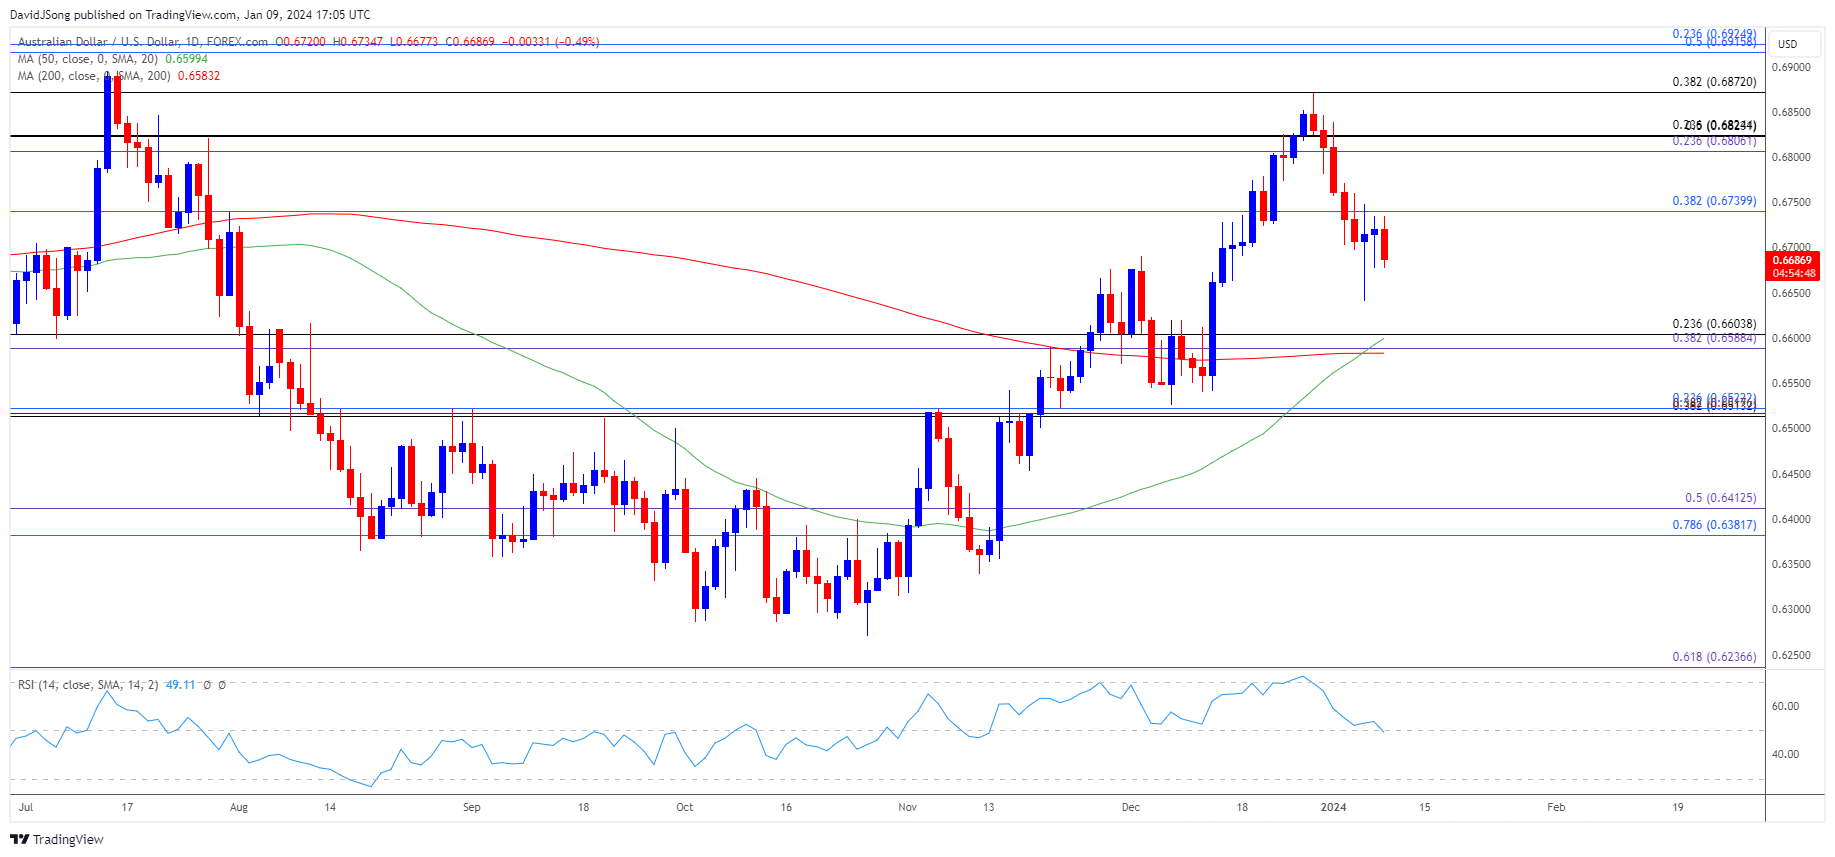
AUD/USD appeared to be on track to test the December low (0.6526) as it reversed ahead of the July high (0.6895), but the exchange rate may respond to the positive slope in the 50-Day SMA (0.6600) it if defends the monthly low (0.6641).
US Dollar Forecast: AUD/USD Susceptible to Test of 50-Day SMA
AUD/USD seems to be stuck in a narrow range after showing a kneejerk reaction to the US Non-Farm Payrolls (NFP) report, and the exchange rate may consolidate over the coming days as the 2.0% rise in Australia Retail Sales does little to sway foreign exchange markets.
Join David Song for the Weekly Fundamental Market Outlook webinar. Register Here
As a result, it remains to be seen if the monthly update to Australia’s Consumer Price Index (CPI) will influence the near-term outlook for AUD/USD as the headline reading for inflation is projected to print at 4.4% in November compared to 4.9% the month prior.
Australia Economic Calendar

Signs of easing price growth may drag on AUD/USD as it encourages the Reserve Bank of Australia (RBA) to retain the current policy at its next meeting on February 6, but a stronger-than-expected CPI reading may generate a bullish reaction in the Australian Dollar as Governor Michele Bullock and Co. keep the door open to further combat inflation.
US Economic Calendar

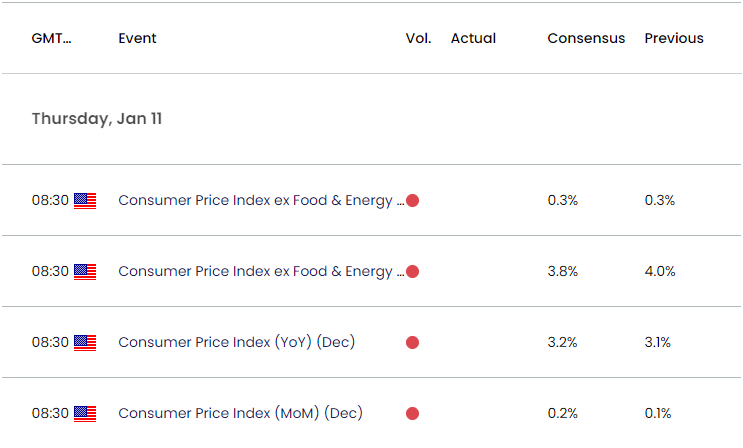
The update to the US Consumer Price Index (CPI) may have similar implications for the Greenback as the Federal Reserve forecasts lower interest rates for 2024, and the yearly opening range is in focus going to the key event risks as AUD/USD appears to be stuck in a narrow range.
With that said, the failed attempt to test the July high (0.6895) may lead to a further pullback in AUD/USD if it struggles to hold above the monthly low (0.6641), but the exchange rate may retrace the decline from the December high (0.6871) should it track the positive slope in the 50-Day SMA (0.6600).
AUD/USD Price Chart – Daily

Chart Prepared by David Song, Strategist; AUD/USD on TradingView
- AUD/USD appeared to be on track to test the December low (0.6526) as it reversed ahead of the July high (0.6895), and the exchange rate may give back the advance from the monthly low (0.6641) as it struggles to trade back above 0.6740 (38.2% Fibonacci retracement).
- A break/close below the 0.6590 (38.2% Fibonacci extension) to 0.6600 (23.6% Fibonacci retracement) region opens up the 0.6510 (38.2% Fibonacci retracement) to 0.6520 (23.6% Fibonacci retracement) zone, with the next area of interest coming in around 0.6380 (78.6% Fibonacci retracement) to 0.6410 (50% Fibonacci extension).
- However, AUD/USD may track the positive slope in the 50-Day SMA (0.6600) if it continues to hold above the moving average, with a close above 0.6740 (38.2% Fibonacci retracement) bringing the 0.6810 (23.6% Fibonacci extension) to 0.6820 (23.6% Fibonacci retracement) region back on the radar.
Additional Market Outlooks
Central Bank 2024 Outlook Preview
US Dollar Forecast: GBP/USD Rebounds within Ascending Channel
--- Written by David Song, Strategist
Follow on Twitter at @DavidJSong


