US Dollar Outlook: AUD/USD
AUD/USD may consolidate ahead of the Federal Reserve interest rate decision on January 31 as it pulls back from a fresh weekly high (0.6625), but the exchange rate may struggle to retain the rebound from the monthly low (0.6525) amid the string of failed attempts to trade back above the 50-Day SMA (0.6652).
US Dollar Forecast: AUD/USD Struggles to Trade Back Above 50-Day SMA
It seems as though AUD/USD will no longer track the positive slope in the moving average as it trades below the indicator for the first time since November, and it remains to be seen if the update to Australia’s Consumer Price Index (CPI) will influence the exchange rate amid the limited reaction to the 2.7% decline in Australia Retail Sales.
Join David Song for the Weekly Fundamental Market Outlook webinar. Register Here
Australia Economic Calendar

The headline CPI is seen narrowing to 3.7% in December from 4.3% per annum the month prior, and signs of slowing inflation may lead to a bearish reaction in the Australian Dollar as it raises the Reserve Bank of Australia’s (RBA) scope to switch gears later this year.
However, a higher-than-expected CPI print may curb the recent decline in AUD/USD as it puts pressure on the RBA to further combat inflation, and Governor Michele Bullock and Co. may keep the door open to pursue a more restrictive policy as the ‘risk of inflation remaining higher for longer.’
US Economic Calendar

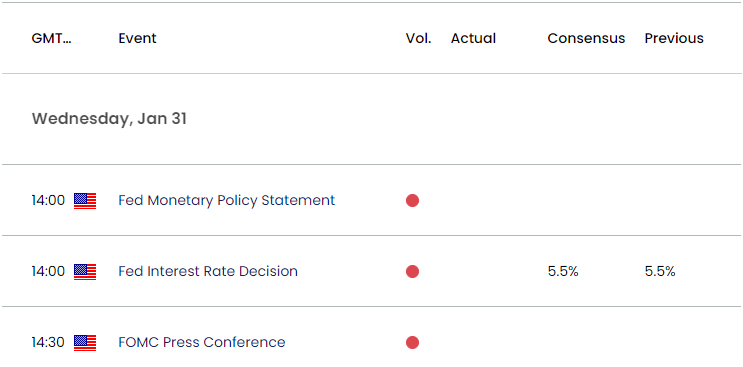
In addition, the Federal Open Market Committee (FOMC) rate decision may sway AUD/USD as the central bank appears to be at the end of its hiking-cycle, and a further adjustment in the central bank’s forward guidance may drag on the Greenback as Fed officials plan to unwind the restrictive policy in 2024.
At the same time, the US Dollar may reflect a bullish reaction if the FOMC shows a greater willingness to keep US interest rates higher for longer, and AUD/USD may struggle to retain the advance from the monthly low (0.6525) amid the string of failed attempts to trade back above the 50-Day SMA (0.6652).
With that said, AUD/USD may no longer track the positive slope in the moving average, but the exchange rate may attempt to retrace the decline from the start of the month should it continue to hold above the former resistance zone around the September high (0.6522).
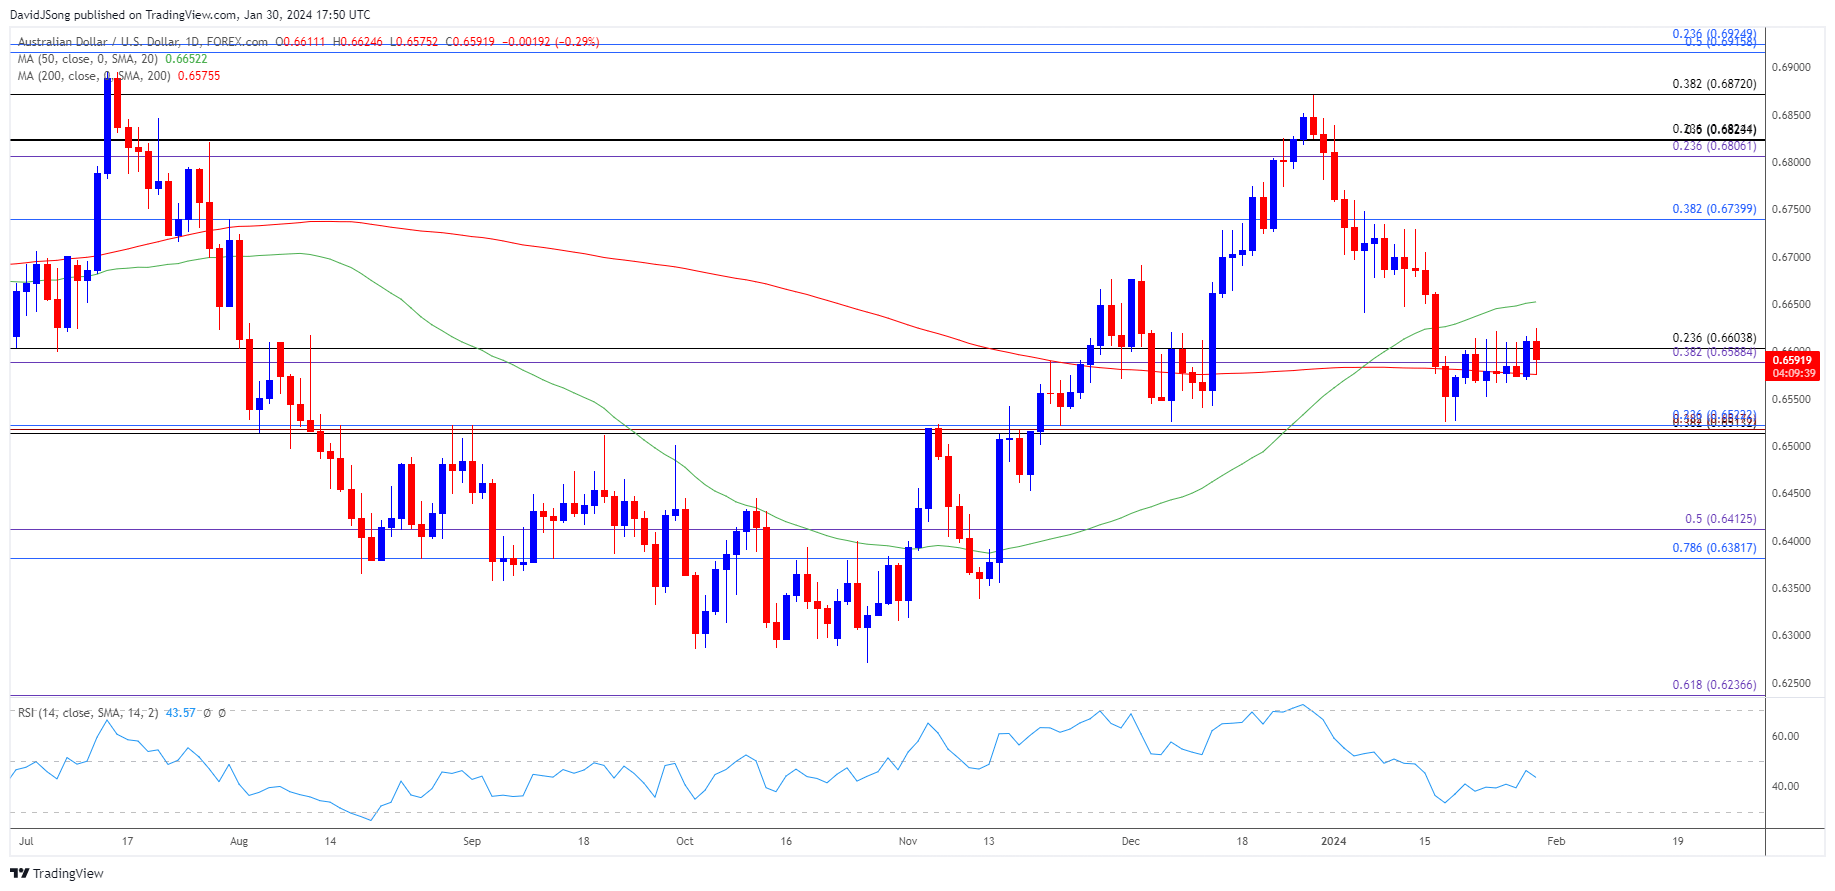
AUD/USD Price Chart – Daily

Chart Prepared by David Song, Strategist; AUD/USD on TradingView
- AUD/USD pulls back from a fresh weekly high (0.6625) to hold below the 50-Day SMA (0.6652), and the exchange rate may no longer track the positive slope in the moving average as it struggles to hold above the 0.6590 (38.2% Fibonacci extension) to 0.6600 (23.6% Fibonacci retracement) region.
- A break/close below the 0.6510 (38.2% Fibonacci retracement) to 0.6520 (23.6% Fibonacci retracement) zone raises the scope for a move towards the 0.6380 (78.6% Fibonacci retracement) to 0.6410 (50% Fibonacci extension) area, with the next region of interest coming in around the November low (0.6318).
- However, AUD/USD may attempt to retrace the decline from the start of the month should it hold above the former-resistance zone around the September high (0.6522), with a breach above the moving average bringing 0.6740 (38.2% Fibonacci retracement) on the radar.
Additional Market Outlooks
US Dollar Forecast: USD/CAD Fails to Test Monthly High Ahead of Fed
US Dollar Forecast: GBP/USD Steady Ahead of Fed Rate Decision
--- Written by David Song, Strategist
Follow on Twitter at @DavidJSong


