US Dollar Outlook: AUD/USD
AUD/USD trades in a narrow range as it struggles to retrace the decline following the Reserve Bank of Australia (RBA) meeting from earlier this month, but the exchange rate is likely to face increase volatility over the remainder of the week as the Federal Reserve is scheduled to announce its last interest rate decision for 2023.
US Dollar Forecast: AUD/USD Post-RBA Weakness Persists Ahead of Fed
AUD/USD bounces back ahead of the monthly low (0.6526) to halt a three-day decline, and the exchange rate may stage a larger recovery as the Federal Open Market Committee (FOMC) is expected to keep US interest rates on hold.
Join David Song for the Weekly Fundamental Market Outlook webinar. Register Here
US Economic Calendar

More of the same from the FOMC may fuel the recent rebound in AUD/USD as the central bank appears to be at the end of its hiking-cycle, and the Fed may gradually adjust the forward guidance as the restrictive policy slows the economy.
However, the FOMC may keep the door open to further combat inflation as the Consumer Price Index (CPI) shows the core reading holding steady in November, and it remains to be seen if the committee will tame speculation for an imminent change in regime as the central bank is slated to update the Summary of Economic Projections (SEP).
In turn, the fresh forecasts Chairman Jerome Powell and Co. may largely influence foreign exchange markets should the interest rate dot-plot show the Fed Funds rate higher for longer, and developments coming out of the Fed’s last meeting for 2023 may influence the near-term outlook for AUD/USD as it trades in a narrow range.
With that said, AUD/USD may attempt to retrace the decline from the first full week of December as it holds above the monthly low (0.6526), but the recovery from the yearly low (0.6270) may unravel amid the failed attempt to test the August high (0.6724).
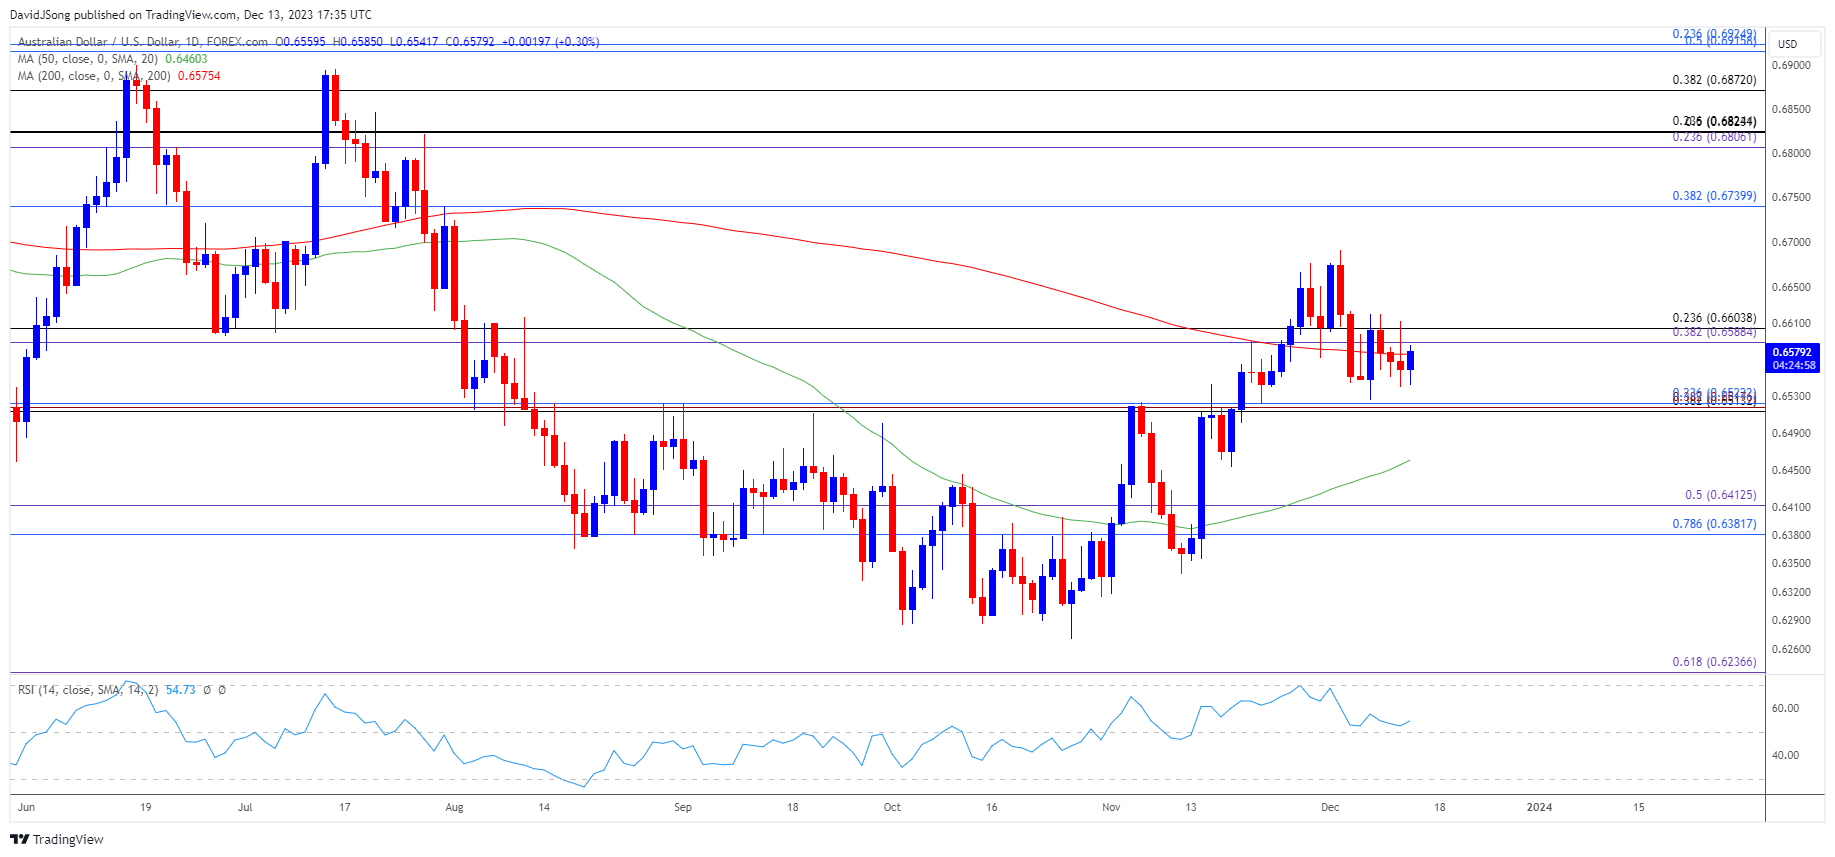
AUD/USD Price Chart – Daily

Chart Prepared by David Song, Strategist; AUD/USD on TradingView
- AUD/USD trades in a narrow range after failing to test the August high (0.6724) during the first week of December, with the Relative Strength Index (RSI) reflecting a similar dynamic during the same period as it struggled to push into overbought territory.
- Lack of momentum to close back above the 0.6590 (38.2% Fibonacci extension) to 0.6600 (23.6% Fibonacci retracement) region keeps the monthly low (0.6526) on the radar, with a break/close below the 0.6510 (38.2% Fibonacci retracement) to 0.6520 (23.6% Fibonacci retracement) area raising the scope for a test of the 50-Day SMA (0.6460).
- Nevertheless, AUD/USD may attempt to break out of the range-bound price action as long as it holds above the monthly low (0.6526), with a close above the 0.6590 (38.2% Fibonacci extension) to 0.6600 (23.6% Fibonacci retracement) region bringing the August high (0.6724) back on the radar.
Additional Market Outlooks
USD/JPY Rate Outlook Hinges on Federal Reserve Interest Rate Decision
US Dollar Forecast: GBP/USD Falls Toward Channel Support
--- Written by David Song, Strategist
Follow on Twitter at @DavidJSong


