US Dollar Outlook: AUD/USD
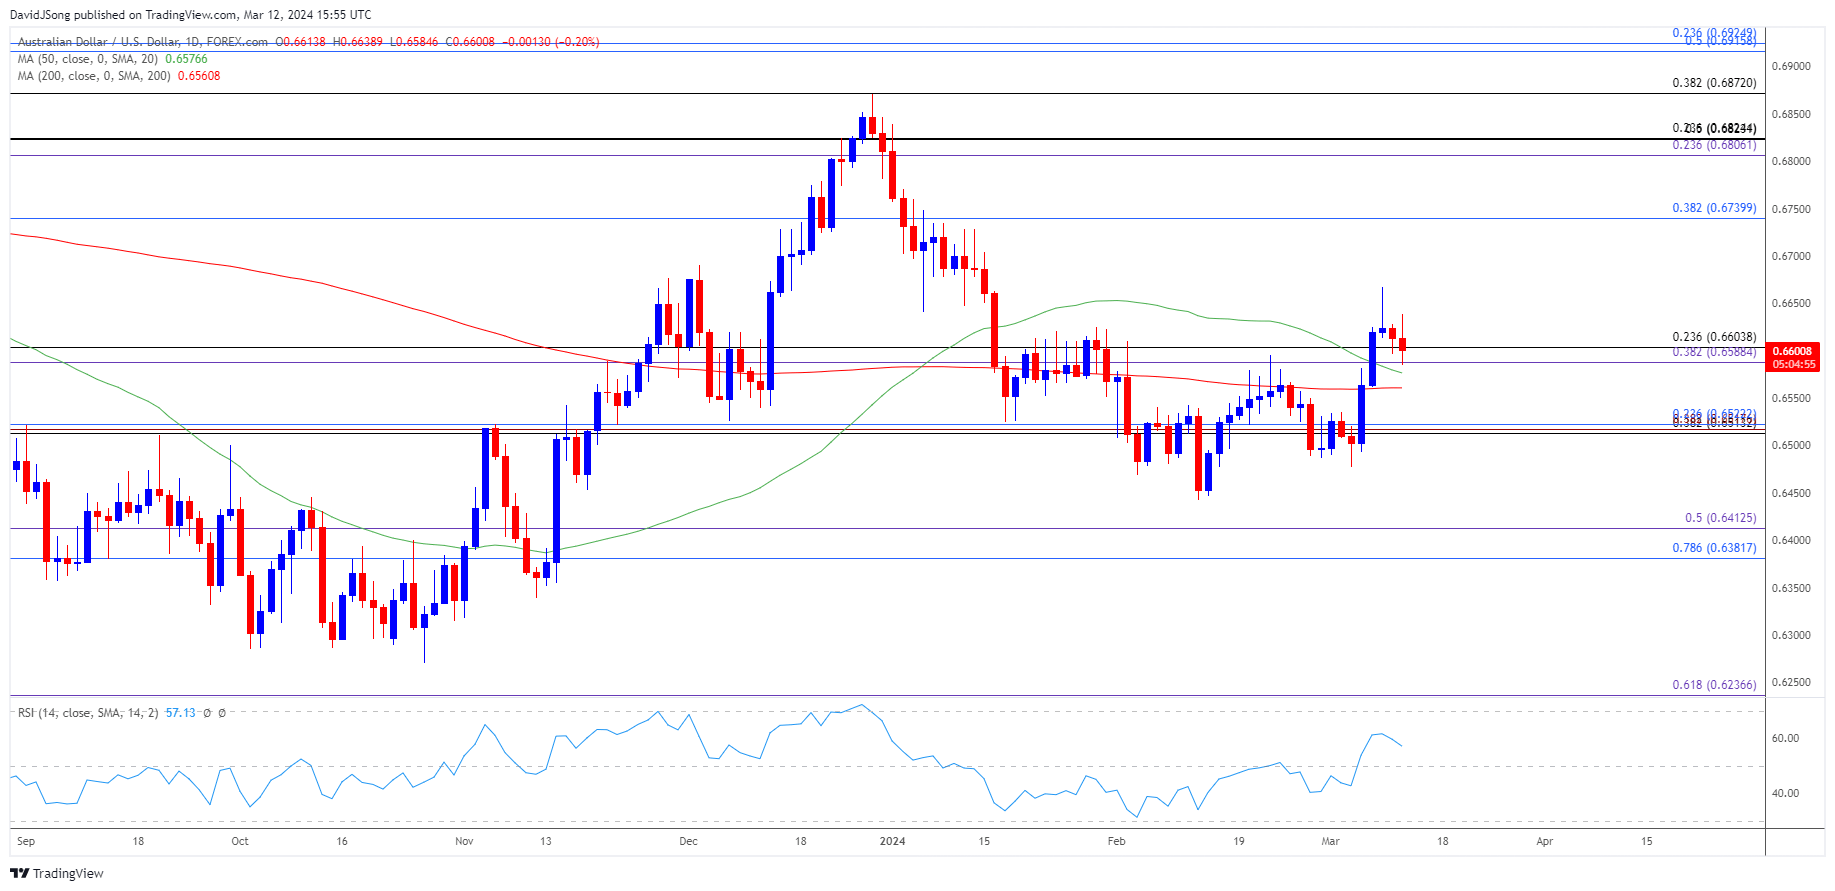
AUD/USD continues to pullback from the monthly high (0.6668) as the update to the US Consumer Price Index (CPI) reveals sticky inflation, but the exchange rate may attempt to further retrace the decline from the January high (0.6839) as long as it holds above the 50-Day SMA (0.6576).
US Dollar Forecast: AUD/USD Holds Above 50-Day SMA Despite Sticky US CPI
Keep in mind, AUD/USD pushed above the moving average during the previous week to clear the February high (0.6610), and the break above last month’s range may signal a potential shift in the near-term trend amid the lack of response to the negative slope in the indicator.
However, AUD/USD may struggle to retain the advance from the monthly low (0.6477) as it snaps the series of higher highs and lows from last week, and data prints coming out of the US may continue to sway the exchange rate as Federal Reserve Chairman Jerome Powell tells US lawmakers that ‘it will likely be appropriate to begin dialing back policy restraint at some point this year.’
Join David Song for the Weekly Fundamental Market Outlook webinar. Register Here
US Economic Calendar

The update to the US Retail Sales report may generate a bullish reaction in the Greenback as private sector consumption is projected to increase 0.8% in February, and a rebound in household spending may encourage the Federal Open Market Committee (FOMC) to keep US interest rates higher for longer in an effort to further combat inflation.
At the same time, a weaker-than-expected US Retail Sales report may produce headwinds for the Greenback as it puts pressure on the Fed to pursue a less restrictive policy, and a dismal development may curb the recent weakness in AUD/USD as Chairman Powell and Co. forecast lower interest rates for 2024.
With that said, the recent pullback in AUD/USD may end up short-lived amid the lack of response to the negative slope in the 50-Day SMA (0.6576), but the exchange rate may struggle to retain the advance from the monthly low (0.6477) if it fails to hold above the moving average.
AUD/USD Price Chart – Daily

Chart Prepared by David Song, Strategist; AUD/USD on TradingView
- AUD/USD pushed above the 50-Day SMA (0.6576) to clear the February range, and the exchange rate may attempt to further retrace the decline from the January high (0.6839) as long as it holds above the moving average.
- Need a break/close above 0.6740 (38.2% Fibonacci retracement) to bring the 0.6810 (23.6% Fibonacci extension) to 0.6820 (23.6% Fibonacci retracement) region on the radar, but AUD/USD may struggle to hold above the moving average if it closes below the 0.6590 (38.2% Fibonacci extension) to 0.6600 (23.6% Fibonacci retracement) area.
- Next region of interest comes in around 0.6510 (38.2% Fibonacci retracement) to 0.6520 (23.6% Fibonacci retracement), with a breach below the monthly low (0.6477) opening up the February low (0.6443).
Additional Market Outlooks
US Dollar Forecast: USD/CAD No Longer Trades in Ascending Channel
US Dollar Forecast: GBP/USD Rally Eyes December High
--- Written by David Song, Strategist
Follow on Twitter at @DavidJSong


