
US Dollar, EUR/USD, GBP/USD, USD/JPY Talking Points:
- The US Dollar has started this week with a continuation of weakness following last week’s CPI-fueled sell-off.
- DXY has started to re-test a confluent support level at 103.50. Interestingly, today and the early week action so far has been driven by a deeper sell-off in USD/JPY as the pair has pushed further below the 150.00 figure after breaching a falling wedge formation last week.
- I’ll be discussing these themes in-depth in the weekly webinar on Tuesday at 1PM ET. It’s free for all to register: Click here to register.
Last week was a busy outing across global markets and this is the week where we can begin to see some digestion of all the facts that have come to light.
The big one that’s continuing to drive markets is the CPI report that was released on Tuesday. This showed US CPI with a continued move-lower and this has driven the hope that the Fed is even closer to finished with rate hikes; and that the next move out of the bank may be a cut rather than another hike.
To be sure this isn’t new, and there was a very similar backdrop a year ago. I had written about this on Monday just ahead of that CPI release and like we had seen last year, a surging USD trend ran through September, stalled in October, and then began to turn in November – with each case being helped along by a CPI print. Last November the 10th that headline CPI print was at 7.7%. This November 13th headline CPI was at 3.2%, which while still elevated has given hope that the Fed may not need to hike anymore to get inflation back to target.
The question now is whether that relationship continues and whether 2023 action continues to mirror 2022; and a major piece of that puzzle is delivering a bit more information to begin this week.
US Dollar Weekly Price Chart (indicative)
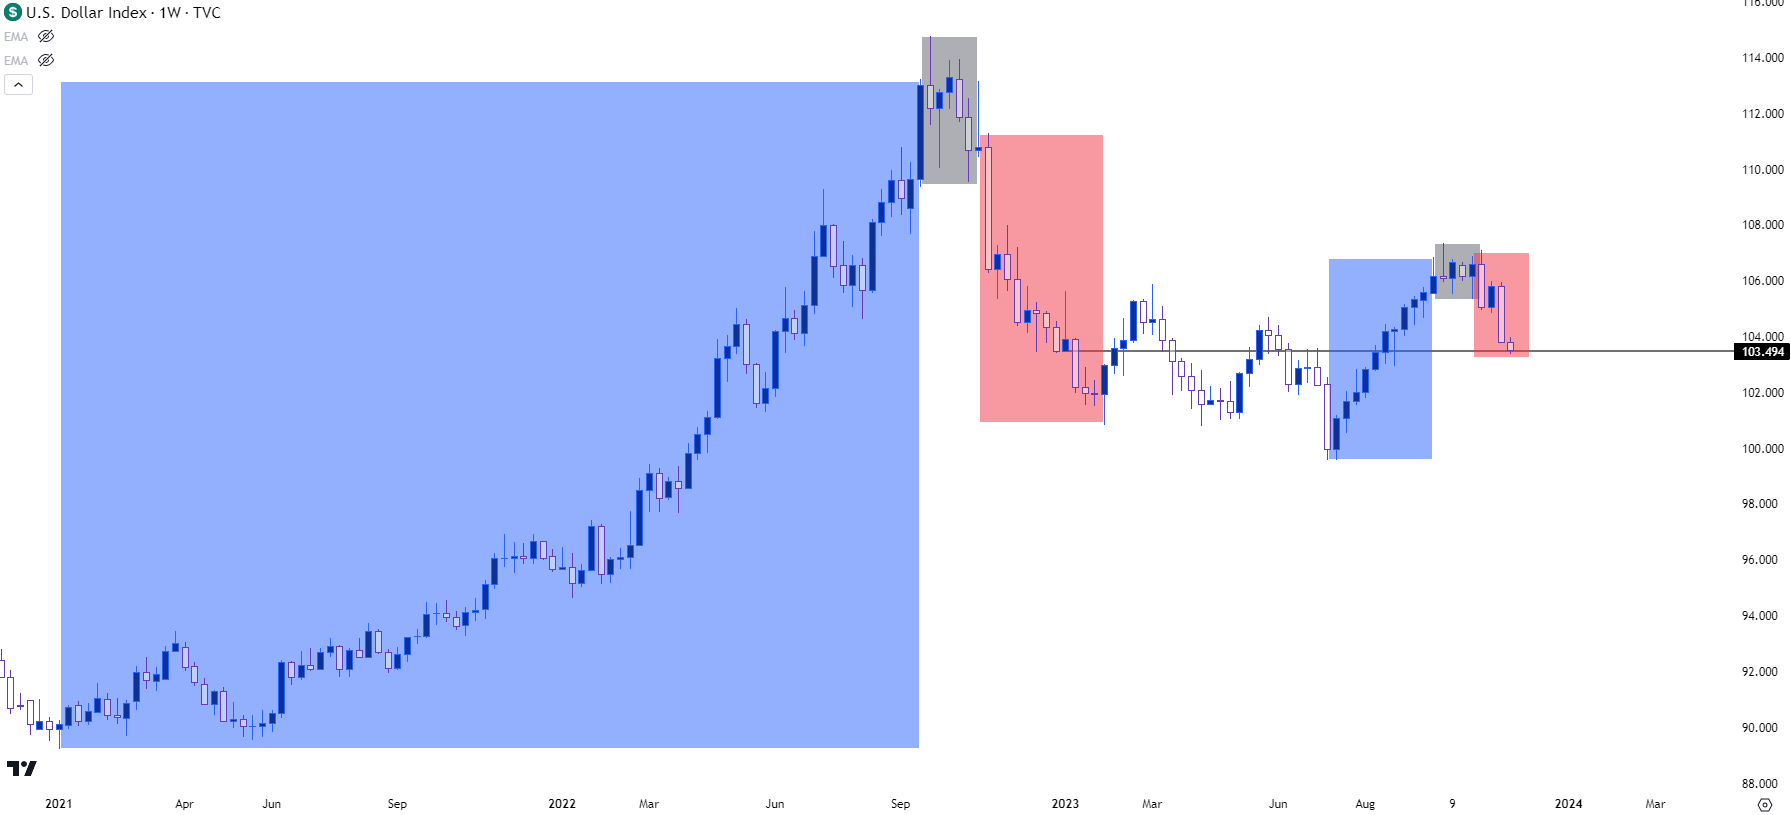 Chart prepared by James Stanley; data derived from Tradingview
USD/JPY
The US Dollar turning in November of last year provided a major help to the Bank of Japan. I had highlighted this last Tuesday, just after the CPI release, and that theme has continued to build over the past week.
Before the USD began to sell-off last year, USD/JPY was surging up to fresh highs as the divergence between US and Japanese monetary policy was continuing to grow. The carry trade remained alive and active, and as traders piled into the pair to clip the positive carry on the long side, a prolonged bullish trend developed – and held – for the better part of 21 months.
The Bank of Japan intervened in the middle of last October in 2022; but that didn’t provoke the reversal, it merely put bulls on their back foot as the pair then held support for almost a full month. And then CPI hit, and USD/JPY began to reverse in earnest.
It took only three months for USD/JPY to wipe out 50% of the rally that had taken 21 months to build. Support showed at the 50% retracement of that major move in January and bulls have been at work since, producing a similar backdrop as last year. Positive carry built a prolonged bullish trend that ran all the way above the 150.00 level in the pair.
USD/JPY Weekly Price Chart
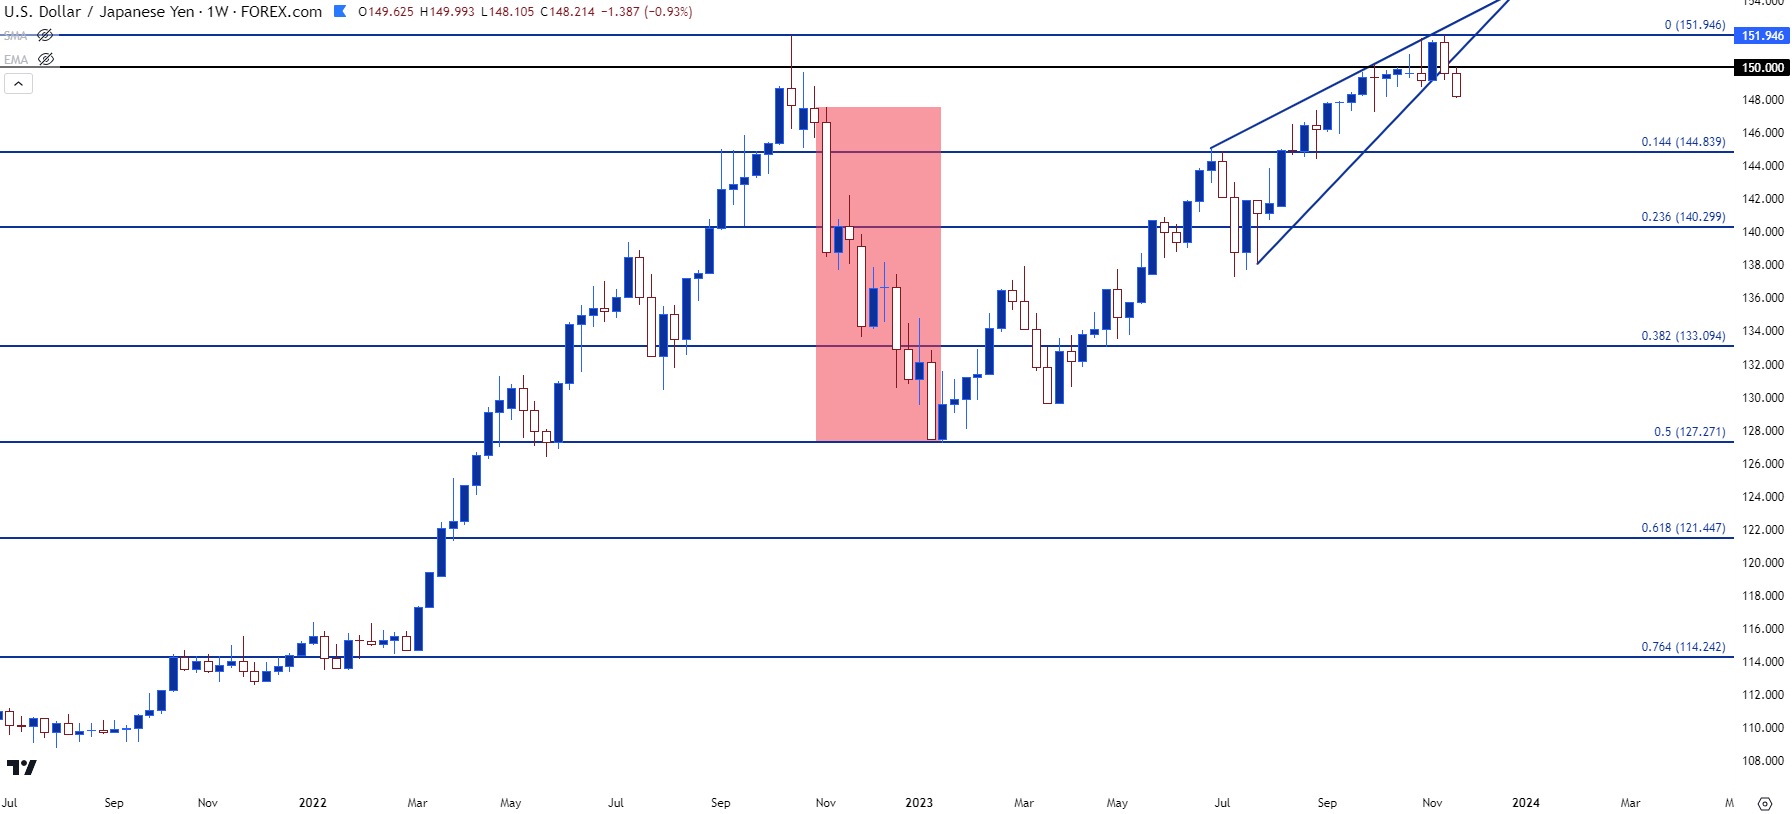 Chart prepared by James Stanley, USD/JPY on Tradingview
But now that the USD is going down, we’ve started to see a similar impact, and as of this writing, USD/JPY has fallen by more than EUR/USD or GBP/USD have went up. As of this writing, DXY is down by -0.38% so far this week while EUR/USD is up by 0.28% and GBP/USD is up by 0.39%. USD/JPY, on the other hand, is down by -0.92%, so that’s outpacing even DXY. Or, to put it another way, USD/JPY is leading the US Dollar move lower, and JPY is the second largest component of the DXY basket so this could remain as a viable issue.
The carry is still positive and there’s been little expectation for change in rates in the near-term from either the United States or Japan. But – much like we saw last year, if there’s a rising risk of principal losses, then carry trades can suddenly lose their attractiveness as the prospect of principal losses outweighing the positive carry makes the trade a far less attractive scenario.
This was like a snowball turning into an avalanche last year in USD/JPY, and the point where that snowball was flung further down the hill was the US CPI report on November the 10th.
The question now for USD/JPY and bigger picture for the USD is whether we’re at another crossroad for such a scenario. The difference at this point is that the sell-off in USD/JPY and the reaction to CPI has been slower so far this year. Last year, bears bolted for fresh lows right after that CPI report had dropped: But here, the pullback has been more methodical.
Last Tuesday was bearish but that led to a support bounce from 150 on Wednesday. That was priced-out on Thursday and Friday with sellers taking another step forward today. But there has been a notable change since that CPI report, even if it pales in comparison to last year’s bearish reaction.
USD/JPY Daily Chart
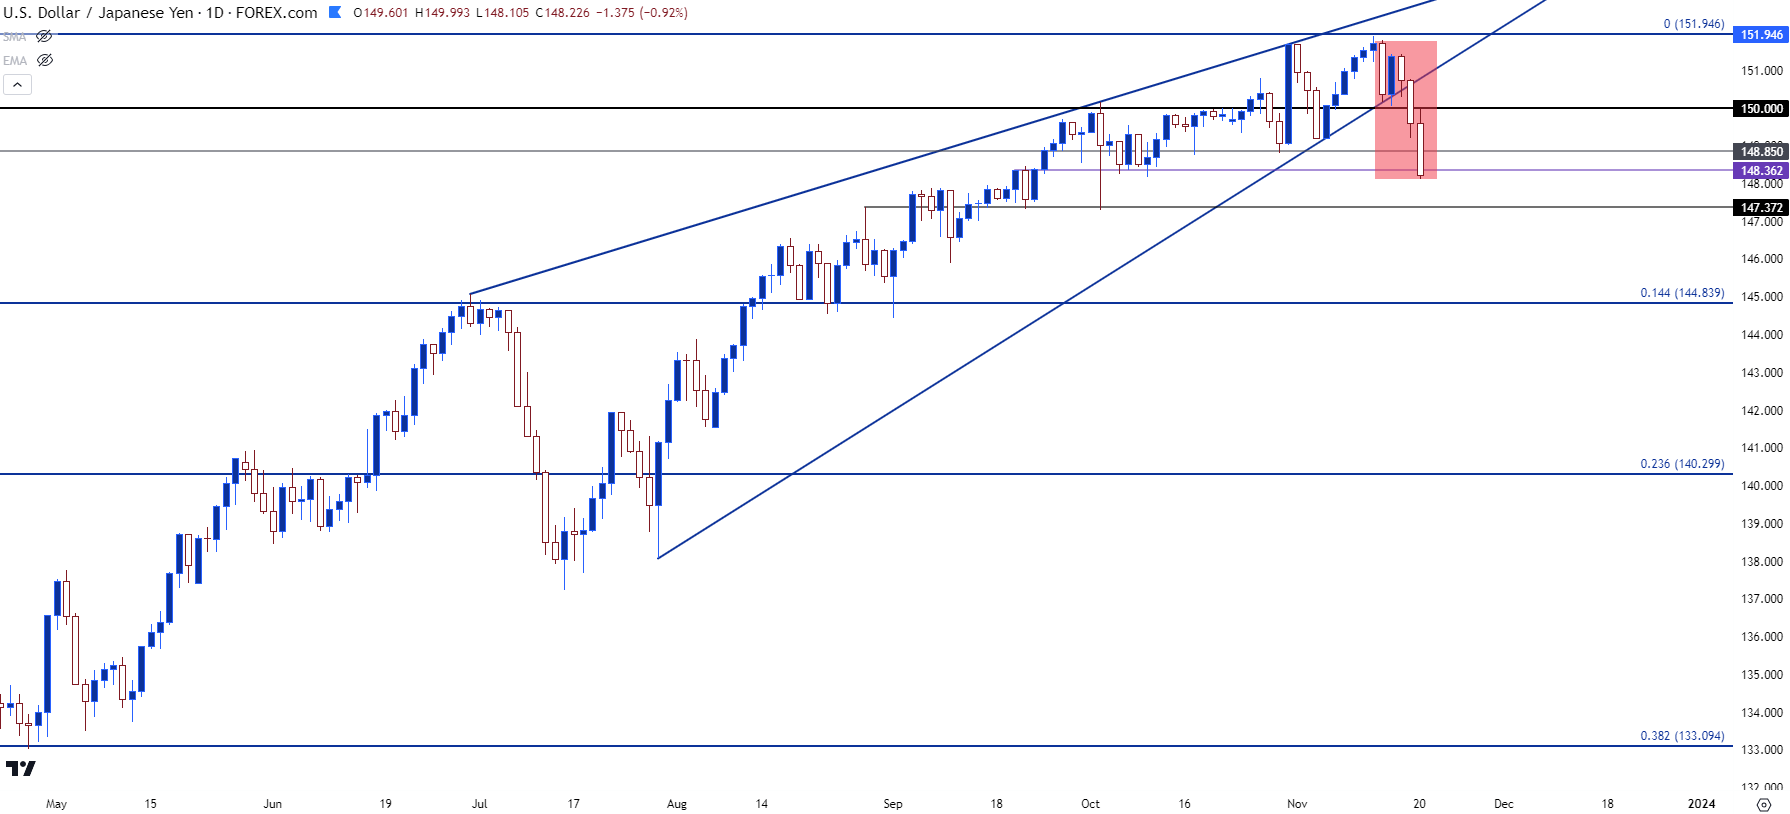 Chart prepared by James Stanley, USD/JPY on Tradingview
EUR/USD
Markets move fast and EUR/USD is an illustration of that.
It was an aggressively bearish trend that drove to fresh lows in September, but that move began to stall after the 1.0500 level acme into the picture. That led to a sloppy outing in October, but there remained a bullish bias in that digestion in the form of a upward-sloping channel.
The Euro makes up 57.6% of the DXY quote which is why the breakdown in DXY last year on November 10th syncs so well with the breakout in EUR/USD on that day. And similarly, last week’s breakdown in the USD propelled a sizable move in EUR/USD; and there’s only be a minimum of pullback thus far.
The pair has started to test the next zone of resistance that runs between 1.0943 and 1.0960, each of which are Fibonacci levels of note. And then overhead is the psychological level at 1.1000. And just like we saw show up in late-September and hold through October trade – psychological levels can prove major points of contention for trend continuation purposes.
EUR/USD Daily Price Chart
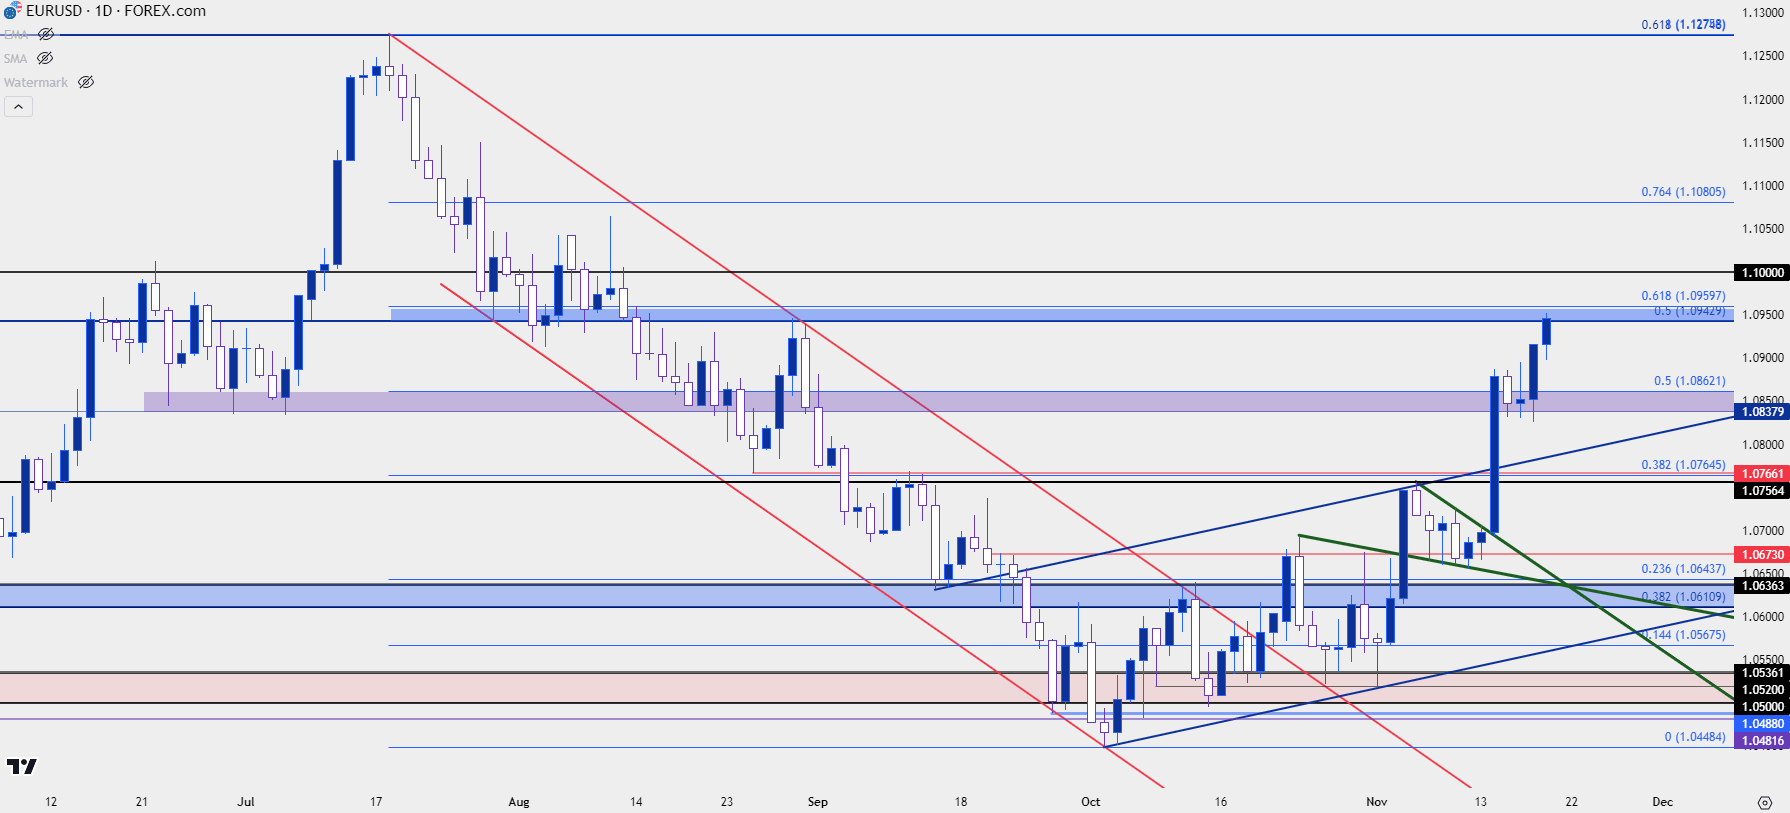 Chart prepared by James Stanley, EUR/USD on Tradingview
GBP/USD
GBP/USD is working on the 1.2500 psychological level, which had come into play a few different times of late. This level caught the high last Tuesday after the breakout had taken hold, and it led to a strong pullback on Wednesday. But the sell-off didn’t last for long as bulls had come back by mid-day on Thursday and this created a doji on the chart, which was then followed by a strong outing on Friday.
As I had shared in the US Dollar Price Action Setups article for this week, this also built another morning star formation in the pair which has kept the focus on topside themes. The next spot of resistance is a little higher, around the 1.2590 level which is a confluent spot as both the 50% mark of the recent sell-off, as well as being a prior price action low.
Above that, a zone of key resistance resides from 1.2720 up to 1.2758.
GBP/USD Daily Price Chart
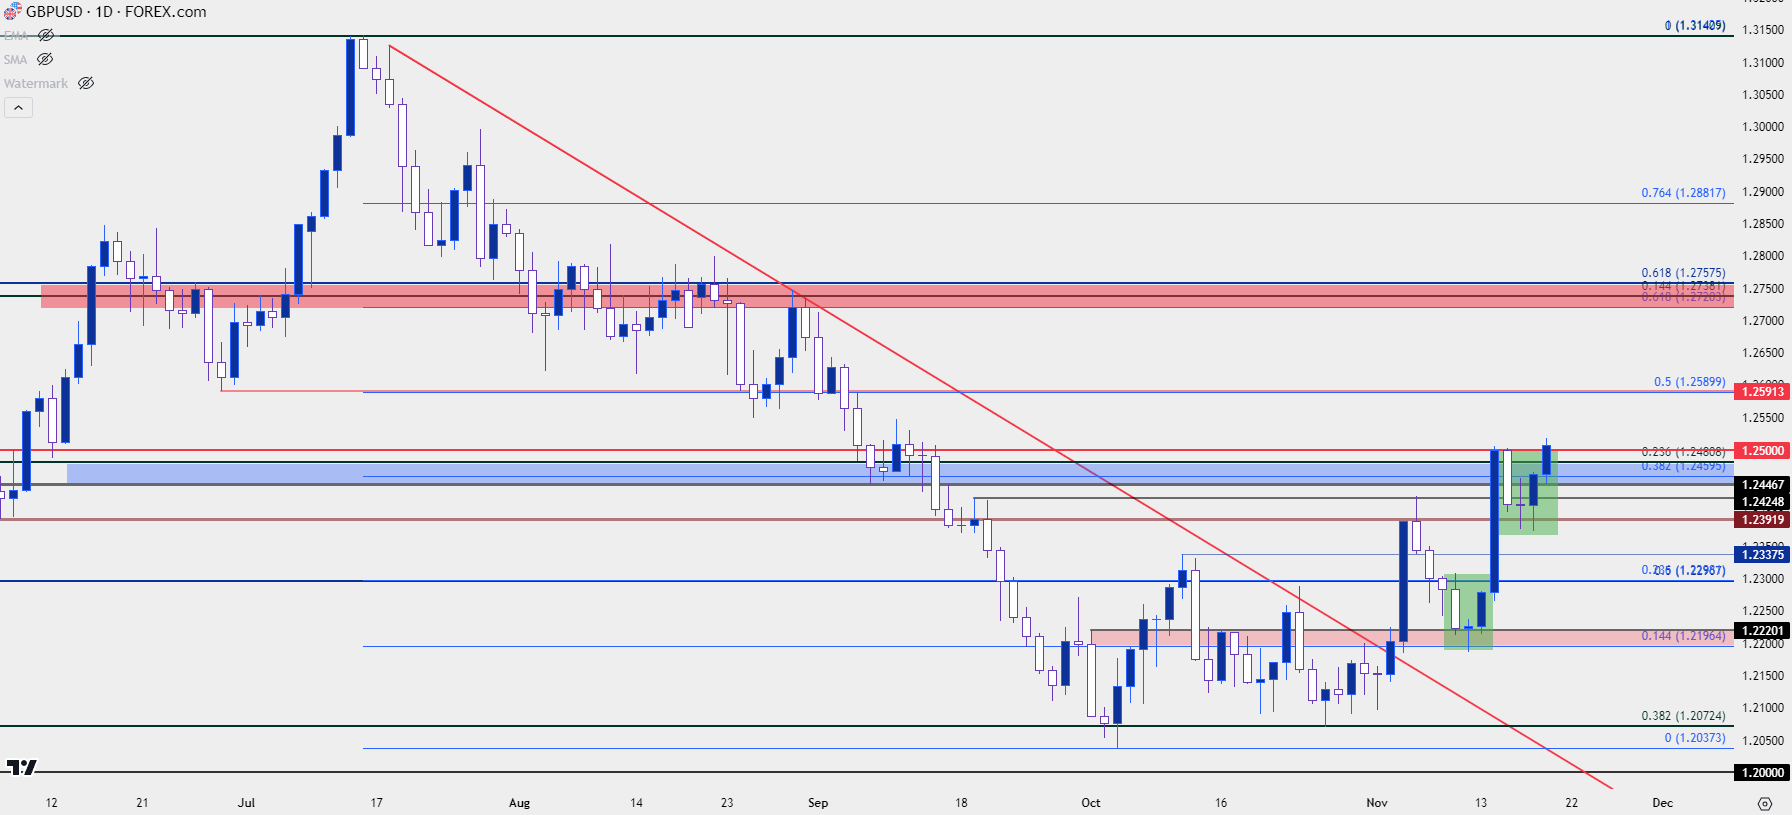 Chart prepared by James Stanley, GBP/USD on Tradingview
--- written by James Stanley, Senior Strategist


