
US Dollar Talking Points:
- It was another bearish week for the USD as the currency continued the fall from the week prior, helped along by a dovish-sounding Jerome Powell and lower-than-expected CPI data on Thursday.
- Also making a mark is the suspected intervention from the Bank of Japan, which pushed USD/JPY back-below the 160.00 handle, and the USD-weakness emanating from that showed in multiple areas, including Gold as the metal looks to retain support above the $2400 psychological level.
- I’ll be discussing these themes in-depth in the weekly webinar. It’s free for all to register: Click here to register.
It’s been another sell-off in the USD this week to continue the bearish theme that sparked the week before. As we came into Q3, the US Dollar was holding near range resistance at the 106.00 level in DXY; and it’s been a consistent string of losses for the currency since the calendar flipped into July.
Monday and Tuesday showed a mild bounce, however, as DXY held resistance at a key zone of 105-105.13. I had highlighted this in the Tuesday webinar and the 105.13 level helped to hold the high into Wednesday.
The large more took place on Thursday, and there were a couple of matters of attention there. The CPI report earlier in the morning again printed below-expectations, helping to give USD-bears a bit of fuel. But it was about ten minutes after the release that USD/JPY went into an aggressive sell-off that’s now suspected to be driven by Bank of Japan intervention. With the Yen taking a 13.6% allocation of DXY, such a move can make a mark, as we can see below.
As of this writing, the US Dollar is putting in a re-test of the 104.08 level in DXY which was a key spot for the currency during Q2 trade as it helped to hold the low in May/June before bulls took another shot.
US Dollar Daily Price Chart: Q3 Sell-Off Continues
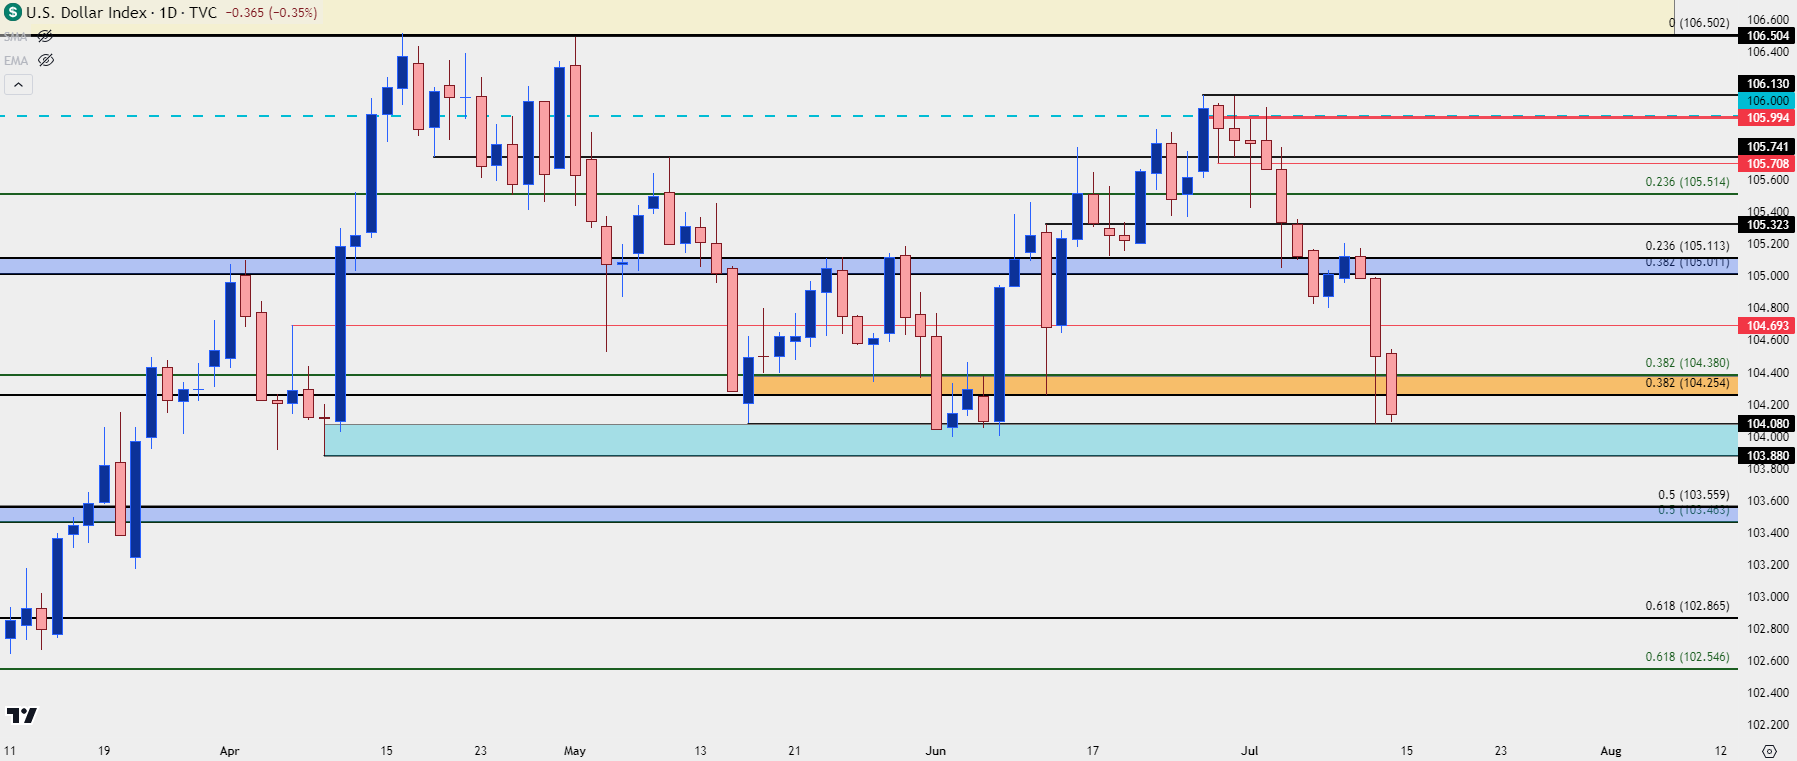 Chart prepared by James Stanley; data derived from Tradingview
The low on Thursday printed at a key level at 104.08 which led to a bounce on Friday, ahead of the most recent data point for PPI. That data printed above expectations but after an initial bounce, USD-weakness returned as USD/JPY fell to a fresh low. Given the BoJ’s prior penchant for intervening on Fridays and the fact that the pair turned-around into a sell-off just a couple of minutes after the data was released, there may be a similar push point behind the Friday move as what was seen on Thursday.
But, from a data perspective, PPI has continued to climb, and producer prices are often thought to have a leading quality for consumer prices, as producers can then pass on those higher costs. So, this could be seen as a buffer to the lower-than-expected CPI read from the day before. On the below chart, notice how the orange line (PPI) shot higher as the blue line (Core CPI) lagged. For the past year PPI has continued to climb while the drawdown in Core CPI has slowed.
US Core CPI (blue) v/s PPI (orange)
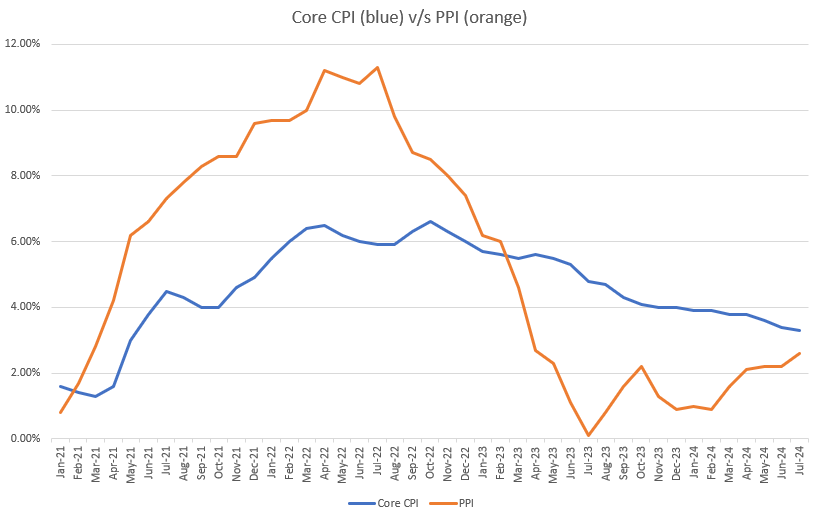
Chart prepared by James Stanley
Rates Markets
Rates markets don’t seem to be too disturbed by that PPI report so far as there’s a current probability of 51.7% for at least three cuts by the end of the year. And with only four meetings remaining on the calendar and July harboring a minor probability of any actual moves, this would deductively highlight the expectation for three consecutive cuts at rate decisions in September, November, and December.
That would be an aggressive cutting posture especially considering that US CPI remains above 3%. But this has shown impact across markets already as US Dollar weakness has been a big theme in early-Q3 trade, and stocks have continued to display strength with the rally broadening out to small caps on Thursday.
Rate Probabilities by End of the 2024
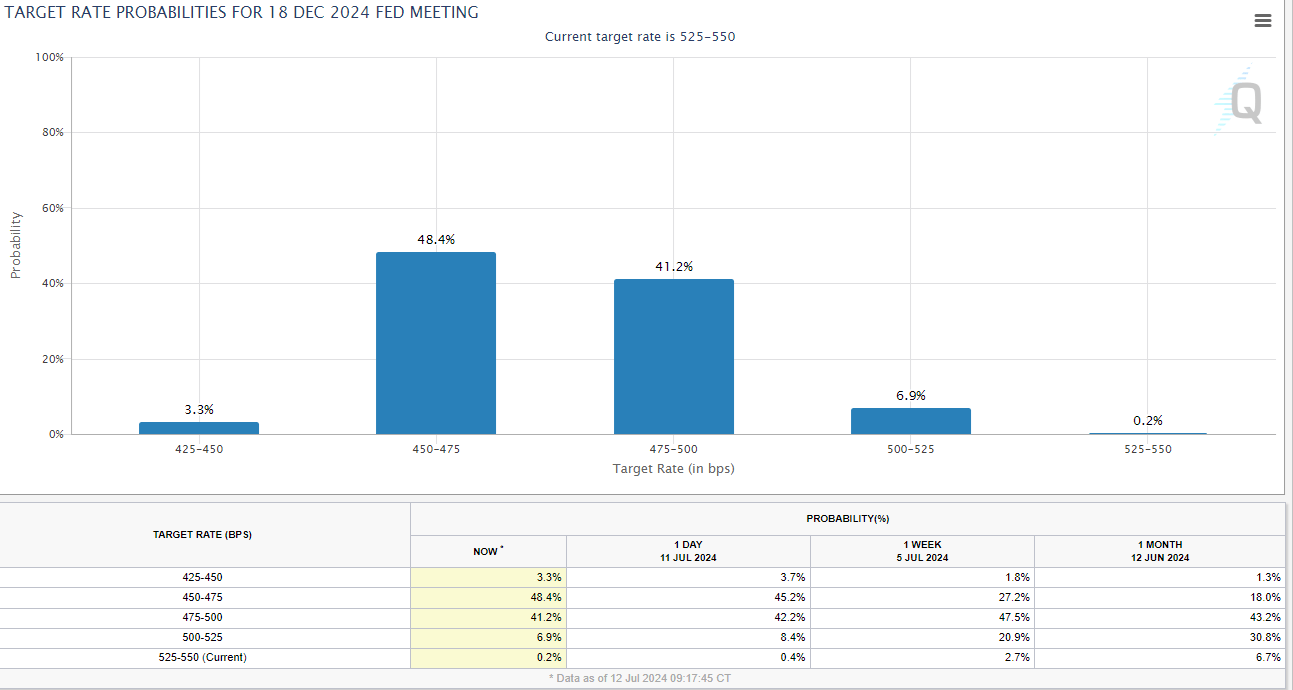 Chart prepared by James Stanley; data derived from CME Fedwatch
US Dollar
The US Dollar has been in a range for 18 months now. And I had highlighted this ahead of the Q3 open, but there’s been a tendency for the Fed to sound dovish when DXY has traded at or around resistance; and correspondingly, this has helped EUR/USD to hold range support even as the ECB began cutting rates in June.
US Dollar Weekly Price Chart
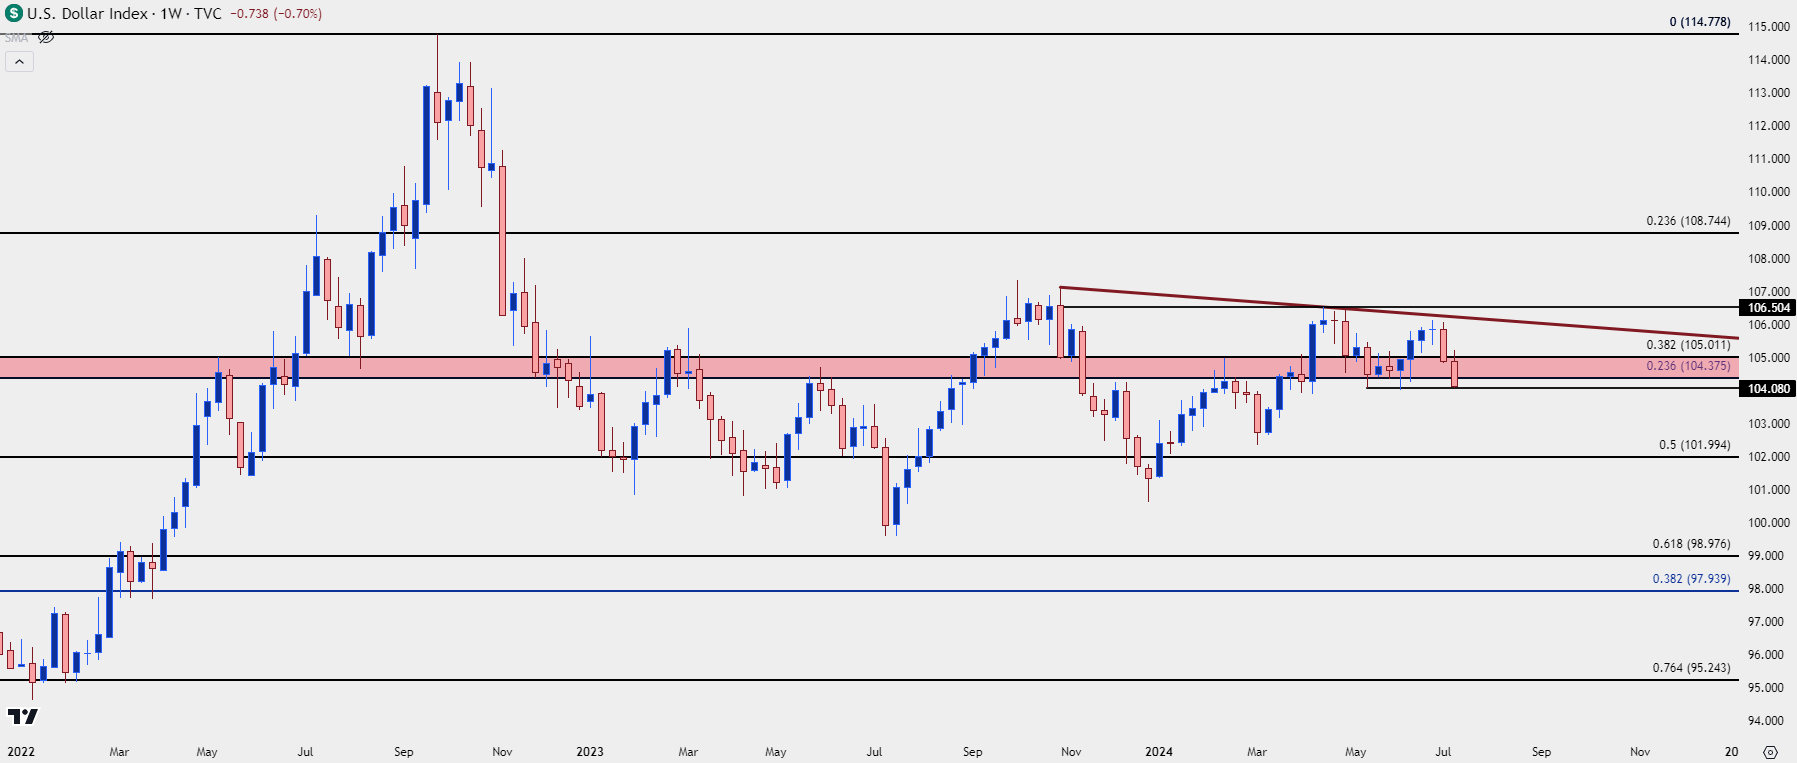 Chart prepared by James Stanley; data derived from Tradingview
USD Daily
On a shorter-term basis, we can see the 200-day moving average coming back into play in late-week trade. Prices tested below that on Thursday but ultimately closed above as bulls pushed the bid after a support test at 104.08. But the follow-through weakness so far on Friday has pressed back below that indicator, and prices are currently re-testing the 104.00 zone that had come in as rigid support in May and June.
US Dollar Daily Price Chart
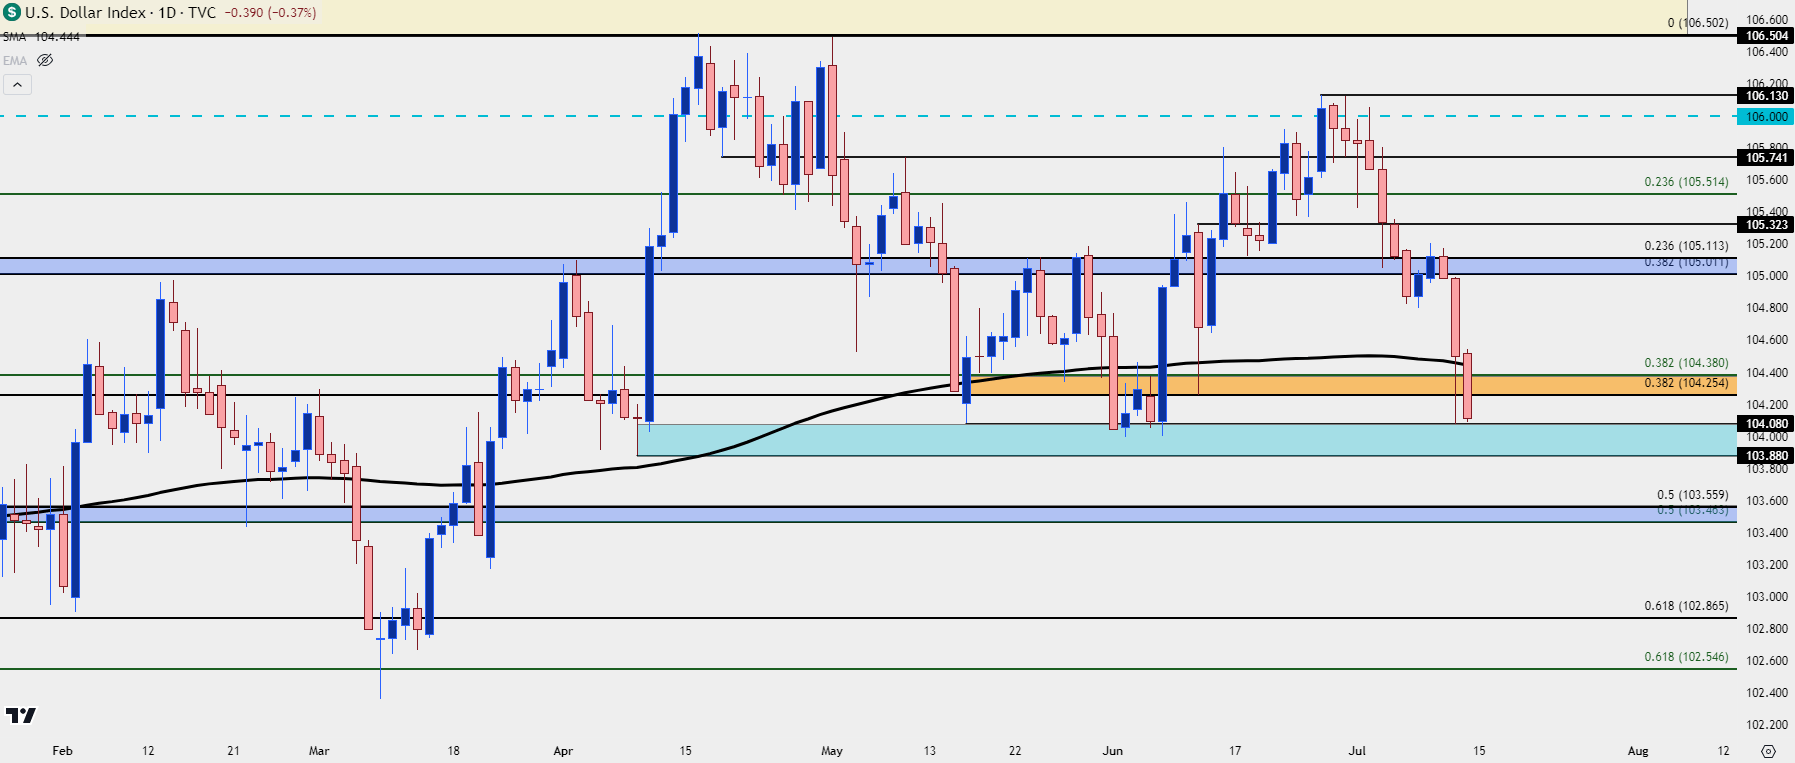 Chart prepared by James Stanley; data derived from Tradingview
EUR/USD
EUR/USD started the week with a support test at a higher-low, with support taken from prior resistance. I had talked about this on Monday and then again on Tuesday during the webinar, but the follow through on Thursday and Friday has so far been impressive as the pair is re-engaging with the 1.0900 level that had helped to hold the Q2 high.
At this point, there’s been a breach of the bearish trendline marking the topside of a symmetrical triangle and this puts bulls in control. The Thursday extended wick even found support at that prior resistance trendline before buyers pushed in a fresh high.
I looked at a few different zones of note in a video on Monday, linked in the article, which highlights the next zone overhead at the 1.0943-1.0960 level. The former price there seems particularly important, as this is the 50% mark from the same Fibonacci study that caught the high in 2023 at 1.1275 (the 61.8% retracement), as well as the low so far in 2024 trade at 1.0611 (the 38.2% retracement).
Above that is the 1.1000 psychological level which held two tests in the opening weeks of 2024 trade, before sellers took over again.
EUR/USD Daily Price Chart
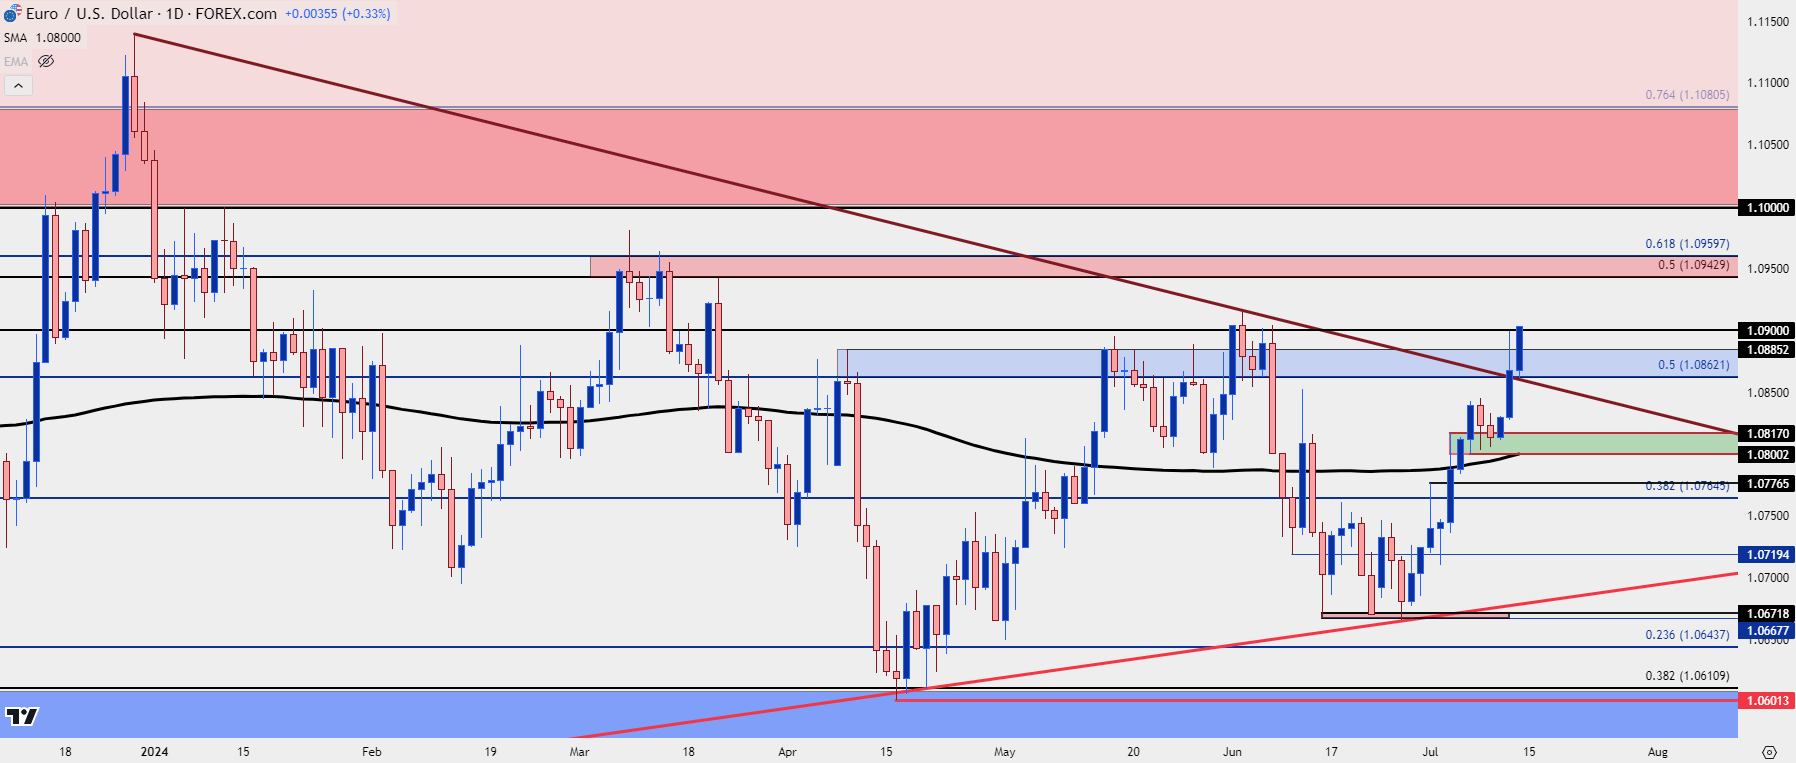 Chart prepared by James Stanley, EUR/USD on Tradingview
USD/JPY
This has been a big driver for the USD this week.
There was a suspected intervention on Thursday following the release of CPI data. I was skeptical of this and thought the move might be more-related to carry unwind as USD pushed-lower after a below-expected CPI print, but the headlines seem to be pointing to the fact that the BoJ did intervene after the data was released.
So far on Friday, there’s been a similar feel with USD/JPY selling off again but this time after strong data that normally would be USD-positive; so, if the BoJ did in fact intervene on Thursday, this may be what we’re seeing on Friday, as well.
Regardless, the carry relationship in the pair remains tilted to the long side of USD/JPY, and sellers are in a negative carry situation so it’s not generally the type of backdrop where bears would want to sit in the trade for long given that it can come along with a daily cost. This is why such relationships often show ‘up the stairs, down the elevator’ price action where trend-side moves are slow and steady, with counter-trend moves as fast and violent.
That’s certainly what was seen in latter-week trade this week and at this point, USD/JPY is testing a trendline taken from December and March swing lows.
Notably, we can see the prior intervention from the Bank of Japan on this chart, as well. I’ve highlighted that with a red box and as noted above, the move was fast and violent. That is until support came into play at prior resistance, at which point bulls got back on the bid and drove the pair right back to the 160.00 handle in the months that followed.
The big question now is whether we see a repeat event of that as the carry relationship remains tilted to the long side of the pair. I think the bearish argument at this point would need to be driven by lower-rate expectations in the US, which could drive carry unwind similar to what we saw in November of 2022 and 2023.
USD/JPY Daily Price Chart
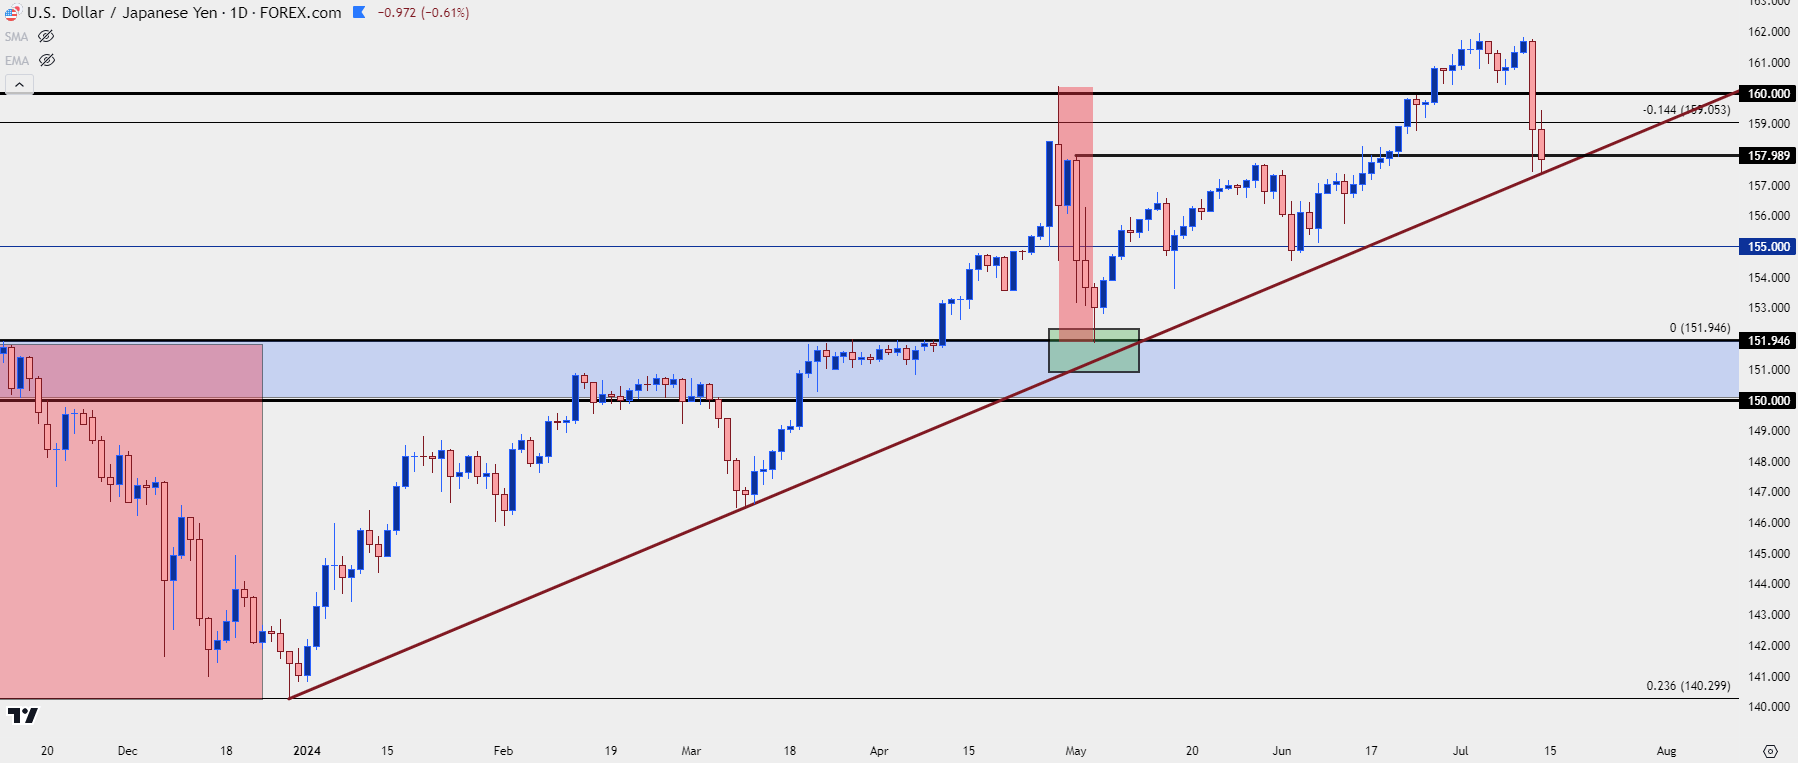 Chart prepared by James Stanley, USD/JPY on Tradingview
GBP/USD 1.3000
I looked into this during the Tuesday webinar and GBP/USD has put in a strong breakout in the back-half of the week.
There was a brewing inverse head and shoulders pattern in the pair and after a minor pullback on Tuesday and Wednesday, bulls hit the bid hard for the rest of the week. At this point, the pair is nearing re-test of the 1.3000 psychological level and this hasn’t been in-play since last July. Daily RSI is already in overbought territory, so this could be a difficult move to chase; and a re-test of the big figure may even bring on counter-trend setups or scenarios. But – a resistance test at 1.3000, followed by a pullback, could potentially be a ‘one step back’ in the higher-high and higher-low sequencing of a trend, so the bigger question is what happens after a pullback in the event that the major psychological level does trade.
GBP/USD Daily Price Chart
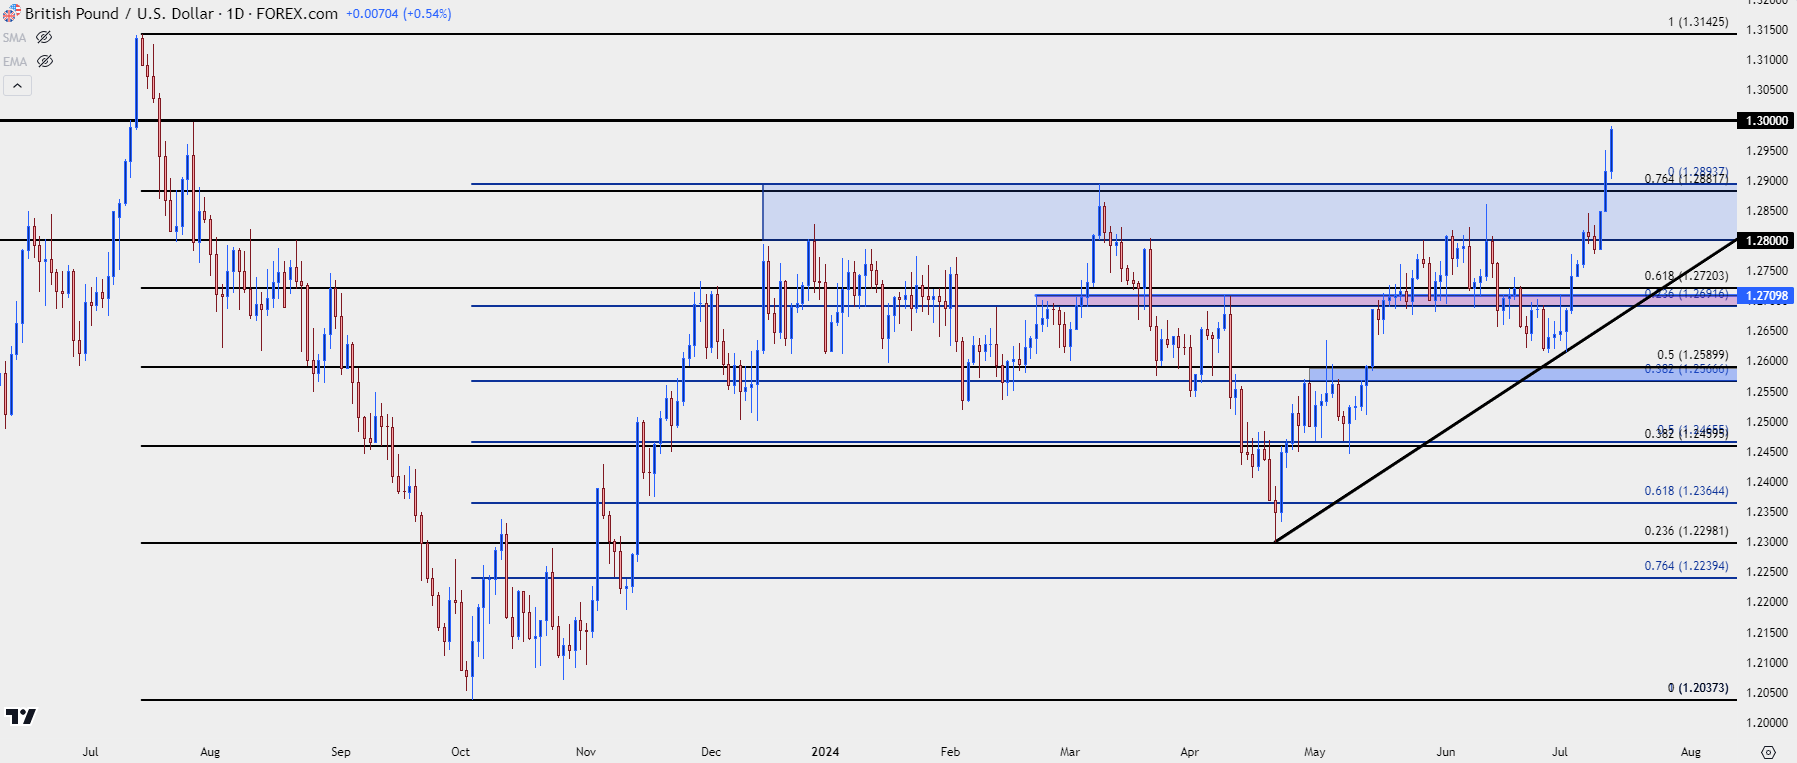 Chart prepared by James Stanley, GBP/USD on Tradingview
Gold (XAU/USD)
It was a grinding Q2 for Gold prices, coming in stark contrast to the aggressive strength that had shown in the month of March.
During that grind, a couple of different bearish formations appeared in the form of a descending triangle and a head and shoulders pattern; both of which require a support break to trigger the formation.
But the other side of the matter saw bulls defending higher-low support as shown by the green trendline on the below chart. That trendline was last in-play two-and-a-half weeks ago, after which bulls put in a strong response that’s continued to drive. And at this point, the metal is holding above the $2400 psychological level which was a stumbling block for bulls throughout last quarter.
Gold Daily Price Chart
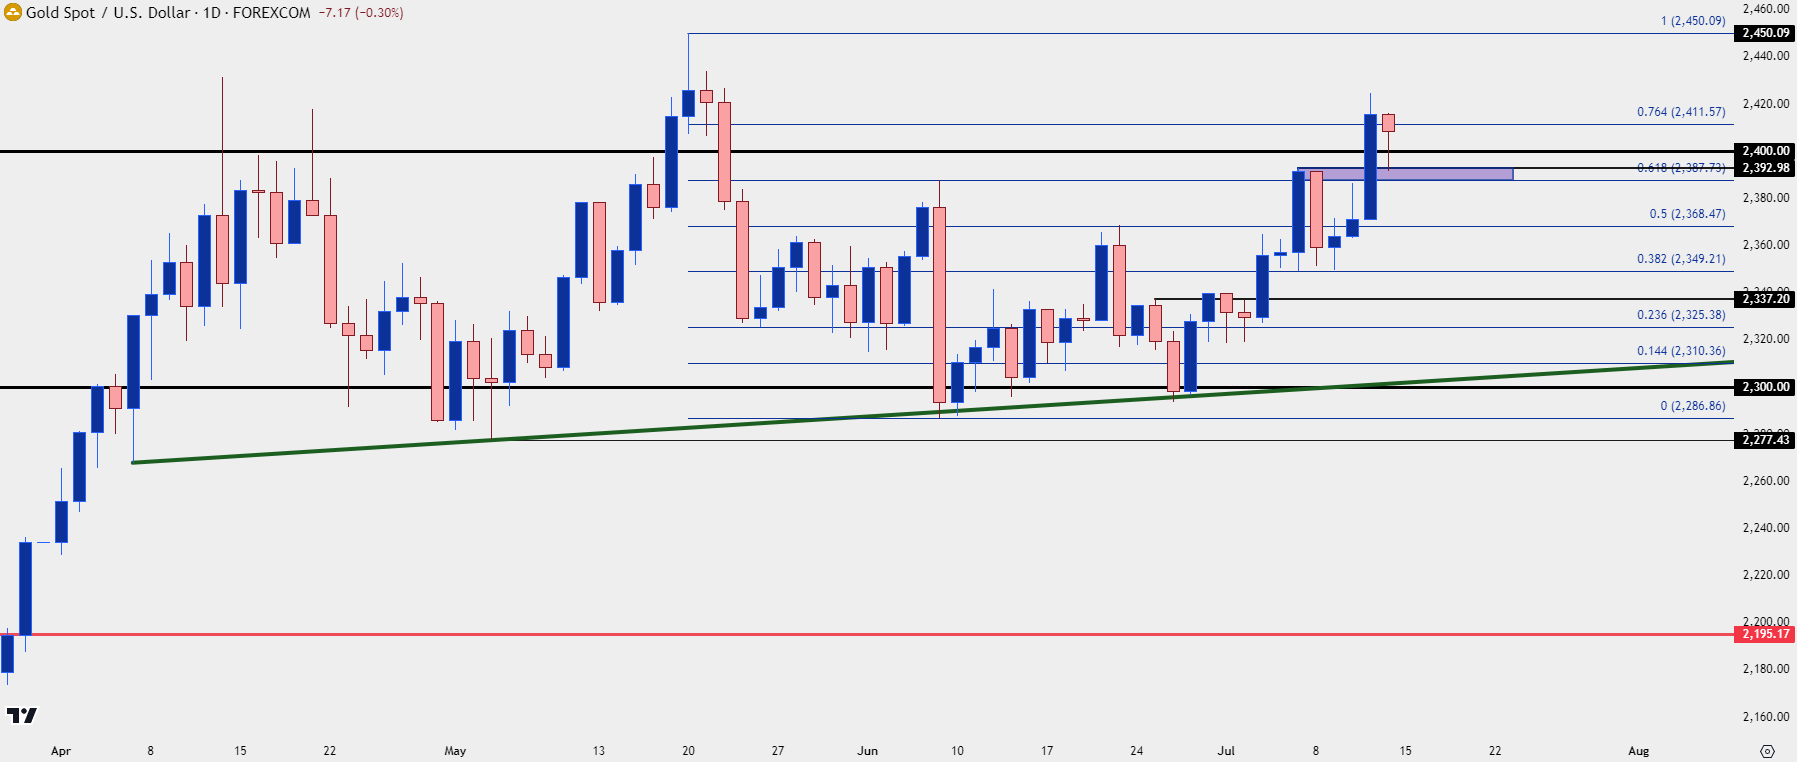 Chart prepared by James Stanley, Gold on Tradingview
On the below weekly chart, we can see the impact of $2400 through a few different instances in Q2, with the all-time-high printed at $2450 in May before sellers came into push back down to support at $2300.
This illustrates a lacking acceptance of prices over the major psychological level but given the persistence of bulls, that could be shifting. The next major level overhead is the $2500 psychological level, and if we do see the ‘three cuts’ thesis continue to gain steam, that could give bulls the motivation to push for a test of the next big figure.
Gold (XAU/USD) Weekly Price Chart
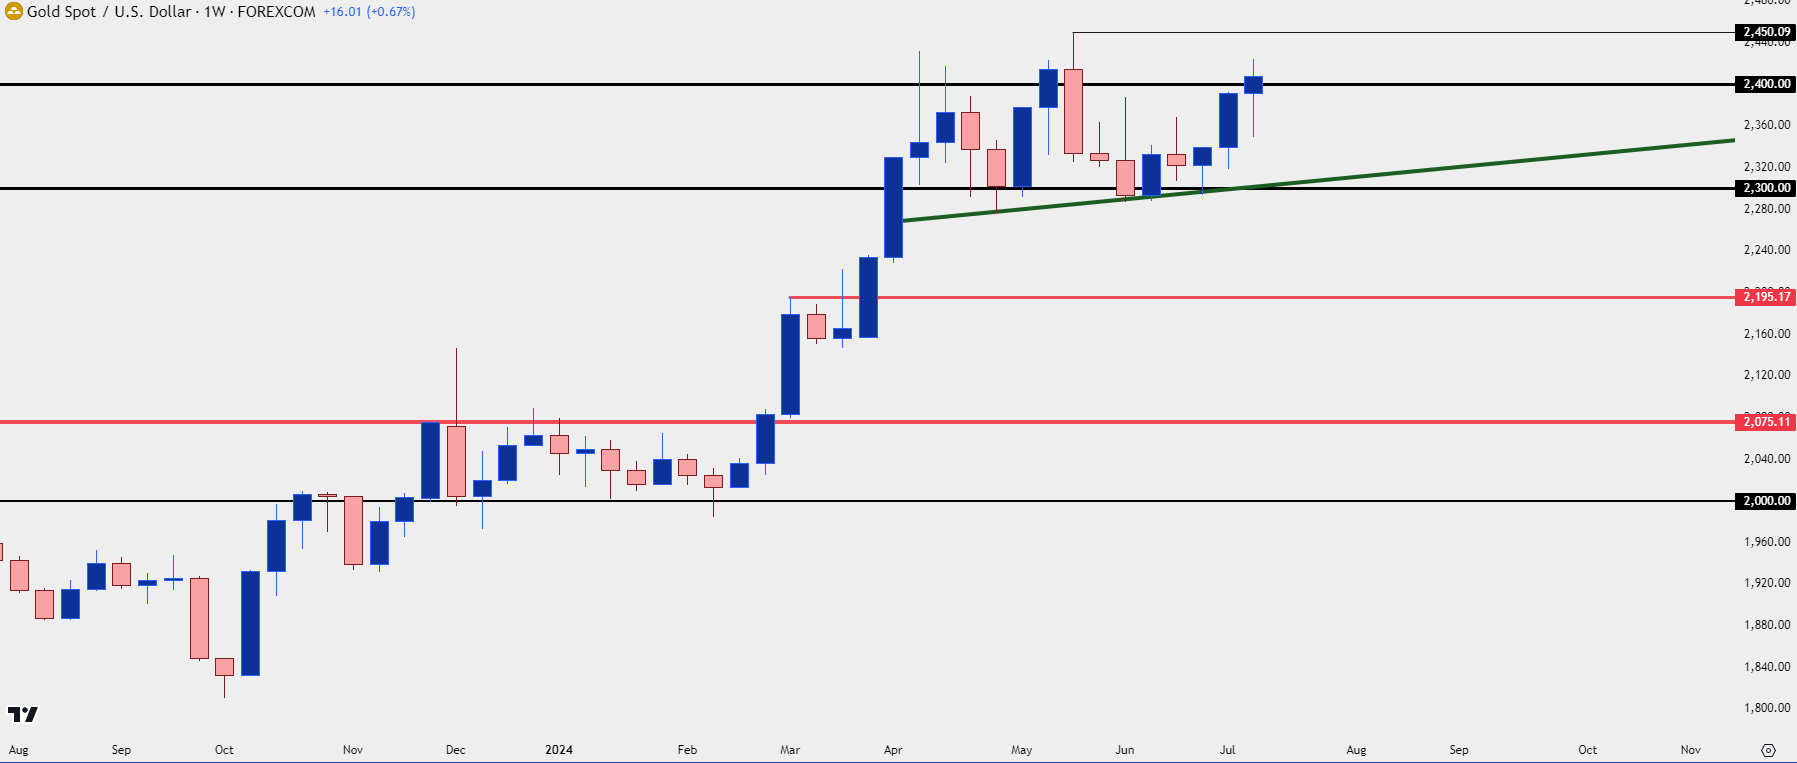 Chart prepared by James Stanley, Gold on Tradingview
--- written by James Stanley, Senior Strategist


