US Dollar Talking Points:
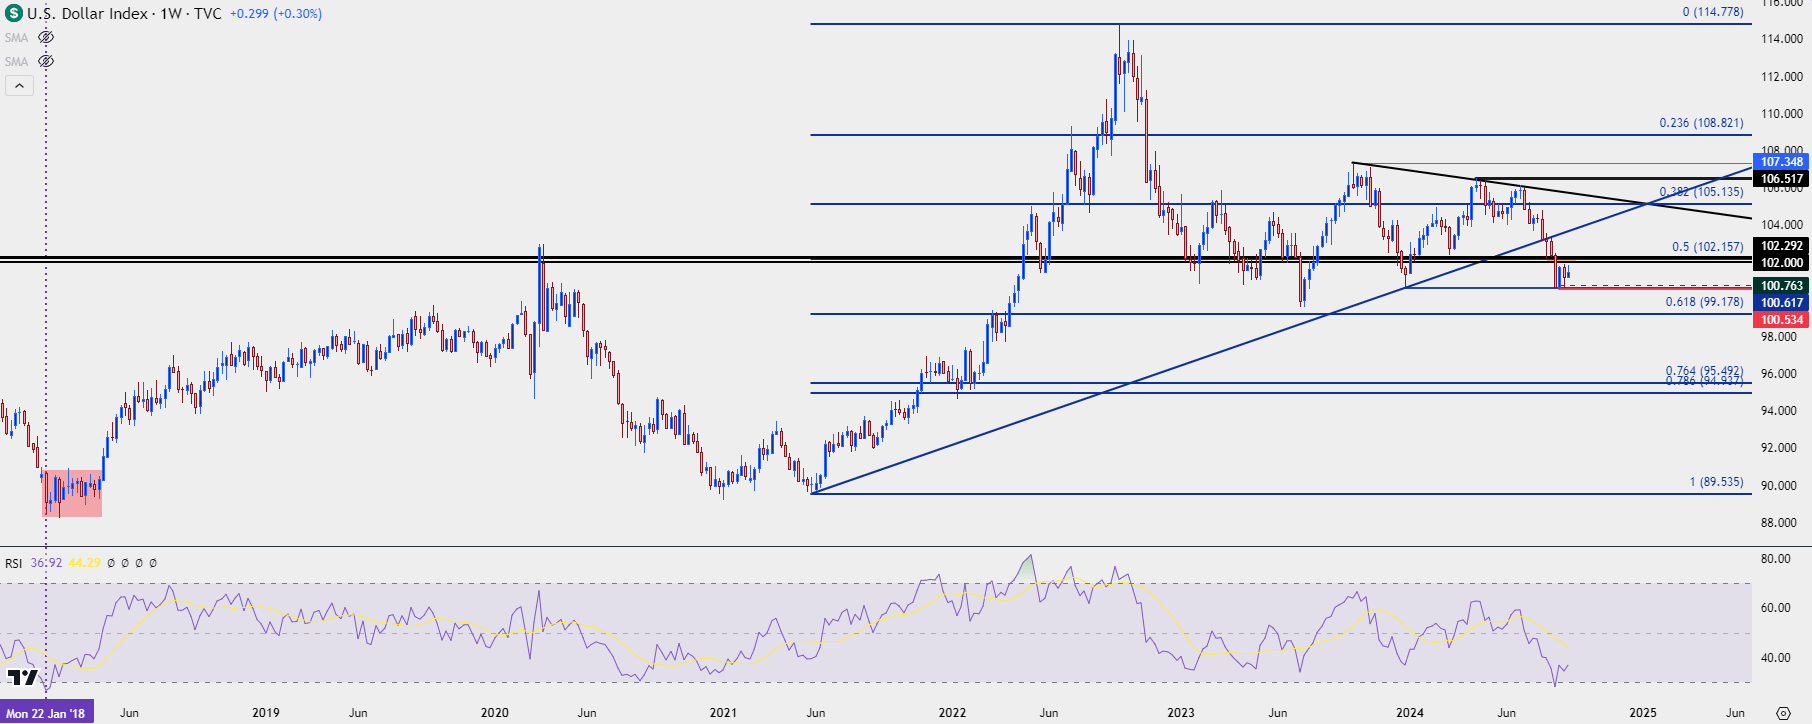
- The US Dollar went oversold on the weekly chart in August for the first time since January of 2018.
- As shown in prior episodes, those situations can take time to rectify, which adds some color to the range that’s built over the past few weeks.
- I’ll be looking into these setups in the Tuesday webinar and you’re welcome to join, click here for registration information.
The US Dollar is a composite which is, I think, an important point to note up-front. It’s comprised mostly of Euro with a 57.6% allocation, followed by Japanese Yen at 13.6% clip. As such, it’s rare to see a concerted one-sided trend drive for a significant amount of time but since the Q3 open, that’s what started to happen.
USD bears pushed and pushed until, eventually, RSI on the weekly chart went into oversold territory for the first time since January of 2018. I had talked about this quite a bit in August as it seemed an outlier type of scenario for me. But, as highlighted then and again today in the video linked above, that isn’t automatically a direct spell for higher-prices. It can, however, lead to digestion as the prior episode in January of 2018 saw ranging grind for about three months before a reversal started to show. And before that, the prior episode, was a mere bounce up to a lower-high followed by sellers making a greater push, so it’s also not a direct item to lead into bullish trends.
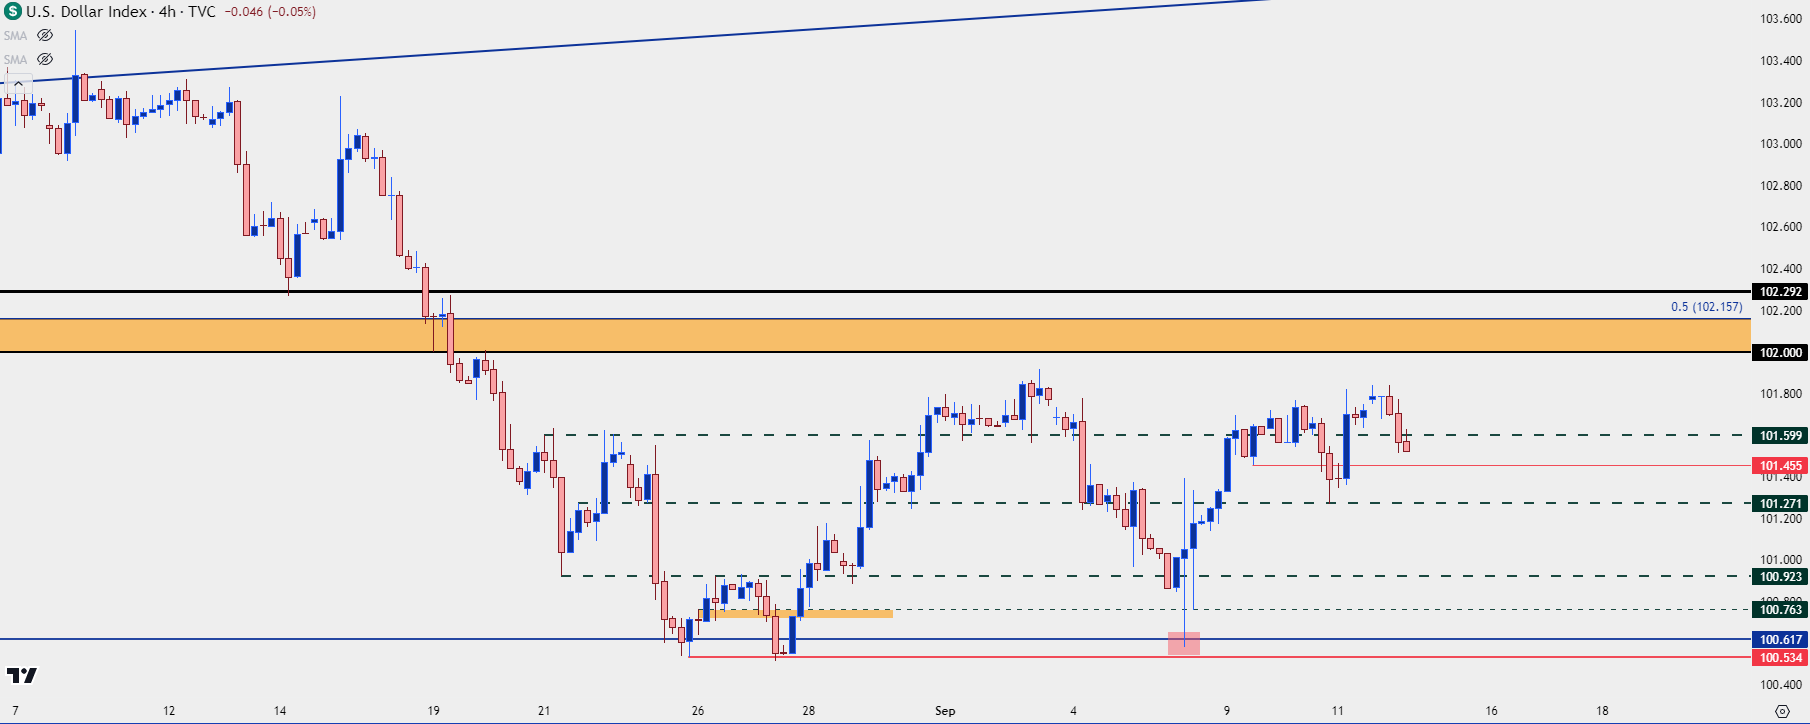
This does, however, put some scope into the recent backdrop around the Dollar which has been more of that ranging grind. Last Friday, sellers had an open door to push a fresh low as the currency was no longer showing an oversold read on the weekly chart. But bears got caught at the same price that held the lows back in December, which sets up a higher-low from the August swing.
For resistance, I’m looking to 102-102.30 as a key zone. If price pushes up there that’s an open door for sellers to take a swing, trying to set a lower-high. The more interesting scenario is if the fail to do so, and if any reaction there merely leads to a higher-low that further pushes into bullish continuation.
US Dollar Four-Hour Price Chart
 Chart prepared by James Stanley; data derived from Tradingview
USD Bigger-Picture
From the weekly chart below we can see that ranging grind that’s built since the lows of a few weeks ago. Given the pace of the sell-off leading into that support, some digestion isn’t all that surprising, but it does highlight how it can take time for such situations to rectify.
Fundamentals can start to come into the equation when looking at the big picture and going back to the first sentence of this article, noting how DXY is a composite, to imagine a harsher breakdown one would need to anticipate greater strength from a large constituent, such as the Euro or Japanese Yen.
Given the economic backdrop in the former that’s difficult for me to imagine. But – what could possibly compel such a move would be a significant move of strength in the Japanese Yen, which could be driven by the prospect of a bigger-picture carry unwind event. I wrote about that quite a bit already this week but to my eyes, it looks like there’s remaining pullback potential in USD/JPY at the moment.
On a longer-term horizon, however, that seems a far more debatable topic.
US Dollar Weekly Price Chart
 Chart prepared by James Stanley; data derived from Tradingview
--- written by James Stanley, Senior Strategist


