The US released a host of December economic data this morning, and all missed BIGLY. December Retail Sales was -1.9% MoM vs and expectation of 0% and a lower revised November print to 0.2% MoM. This was apparently due to people moving forward their holiday shopping to make sure items arrived on time. December’s Retail Sales ex-Autos print was -2.3% MoM vs +0.2% MoM expected and a lower revised November print to 0.1% MoM. Also, this morning, the US released Industrial Production for December at -0.1% MoM vs +0.3% MoM expected. The November print was revised slightly higher to 0.7% MoM for November; however, the revision wasn’t enough to make December’s print stronger. Manufacturing Production for December was -0.3% MoM vs +0.5% MoM expected and a lower revised print for November of 0.6%. Again, a miss.
That brings us to January’s preliminary Michigan Consumer Sentiment data. The headline print was 68.8 vs 70 expected and 70.6 in December. The miss was primarily in the expectations component, which was 65.9 vs 66.5 expected. The current conditions component was 73.2 vs 73.3 expected.
None of that matters! The Fed is looking at inflation. The 1-year inflation outlook from the consumer sentiment data was in-line at 4.9% vs 4.8% in November. The 5-year inflation outlook was 3.1% vs 2.9% expected and 2.9% in November. This means that in 5 years, consumers expect inflation to still be 3.1%. Remember: The Fed targets 2% inflation!
It's not a surprise that Fed speakers this week were all hawkish. Fed members Barkin, Messer, George, Daly, Harker, Waller and Williams all spoke this week, in addition to the nomination hearings for Powell and Brainard. Most suggested a rate hike in March may be appropriate! Even the biggest Fed dove, Neel Kashkari said that he is looking for 2 rate hikes this year! This is despite the weaker Non-Farm Payroll data over the last 2 months, which averaged only +224,000 jobs.
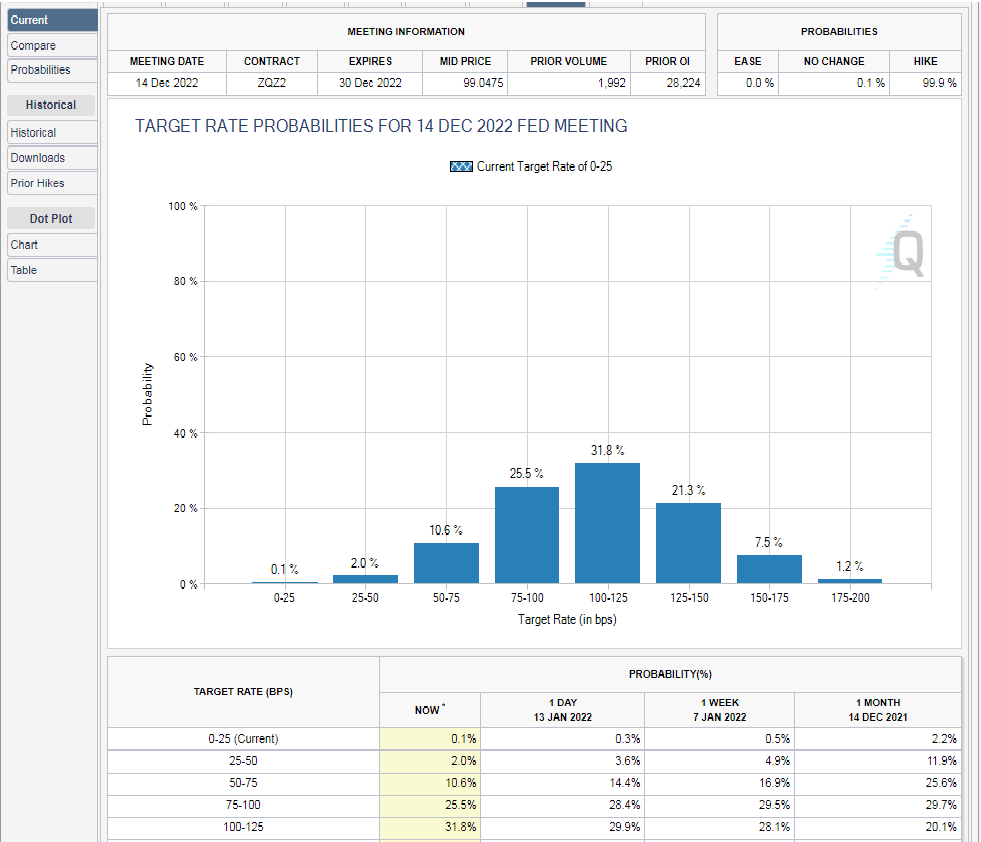
As a result, markets are currently pricing in 4 rate hikes over the remainder of 2022 according to the CME FedWatch Tool:

Source: CME
This should be bullish news for the US Dollar Index. The DYX has moved back above the bottom trendline of the long-term, upward sloping channel the pair has been in since May 2021. Horizontal resistance above is at 95.52 ahead of the 50 Day Moving Average at 95.88. Thus far, price has held the 61.8% Fibonacci retracement from the October 28th, 2021 lows to the November 24th highs near 94.66. If the DXY breaks below there, it can fall to the horizontal support at 94.30 and 93.35.

Source: Tradingview, Stone X
Today’s US data releases were all worse than expected. But the only ones the truly matter are the inflation components of the Michigan Consumer Sentiment Survey. With inflation expectations well above the Fed’s 2% target, the Fed is signaling rate hikes are coming sooner than later! Watch the DXY for clues on how to trade US Dollar pairs.


