Return of the Carry Trade?
This year saw a massive unwind of the carry trade with USD/JPY plunging more than 13.8% in a spectacular ten-week sell-off. The decline was widely telegraphed as the death of a multi-year uptrend in the U.S. Dollar as the entire yearly advance was erased. Yet, just eight-weeks later USD/JPY had rallied 12.3% off the lows with a V-shaped recovery taking price into major resistance into the close of the year.
Japanese Yen Price Chart- USD/JPY Weekly

Chart Prepared by Michael Boutros, Sr. Technical Strategist; USD/JPY on TradingView
The sharp defense and recovery of key support at the 61.8% retracement of the 2023 advance / 2024 yearly open at 140.49-141 keeps 2021 advance viable heading into the start of the year. Key resistance is eyed at the 78.6% retracement of the July decline / July weekly breakdown close at 157.17/89- note that a 2020 parallel converges on this zone and a break / weekly close above is needed to mark resumption of the broader uptrend towards the 1190 high / 2024 high-week close (HWC) at 160.40/73 and the yearly high at 161.95- both levels of interest for possible topside exhaustion / price inflection IF reached.
Weekly support rests at 152 and is backed closely by the 2022 high-close / 2023 HWC at 148.73-149.60. Broader bearish invalidation is set to the 61.8% retracement of the September advance at 146.59- a break / close below this threshold would suggest a more significant high is in place / a larger trend reversal is underway toward the 2024 low-week close (LWC) at 143.90 and the yearly lows.
Bottom line: The USD/JPY recovery off the yearly lows is testing uptrend resistance into the close of the year. From at trading standpoint, losses should be limited to 152 IF USD/JPY is heading higher on this stretch with a close above 157.89 needed to fuel the next leg higher in price.
Crypto Resurgence to Gather Pace
A regulatory cloud has hung over the Bitcoin for the past four-years as traders weighted the potential for increased scrutiny on the maturing market. The crypto world may now be poised for a renaissance as a new ‘crypto-friendly’ administration assumes power.
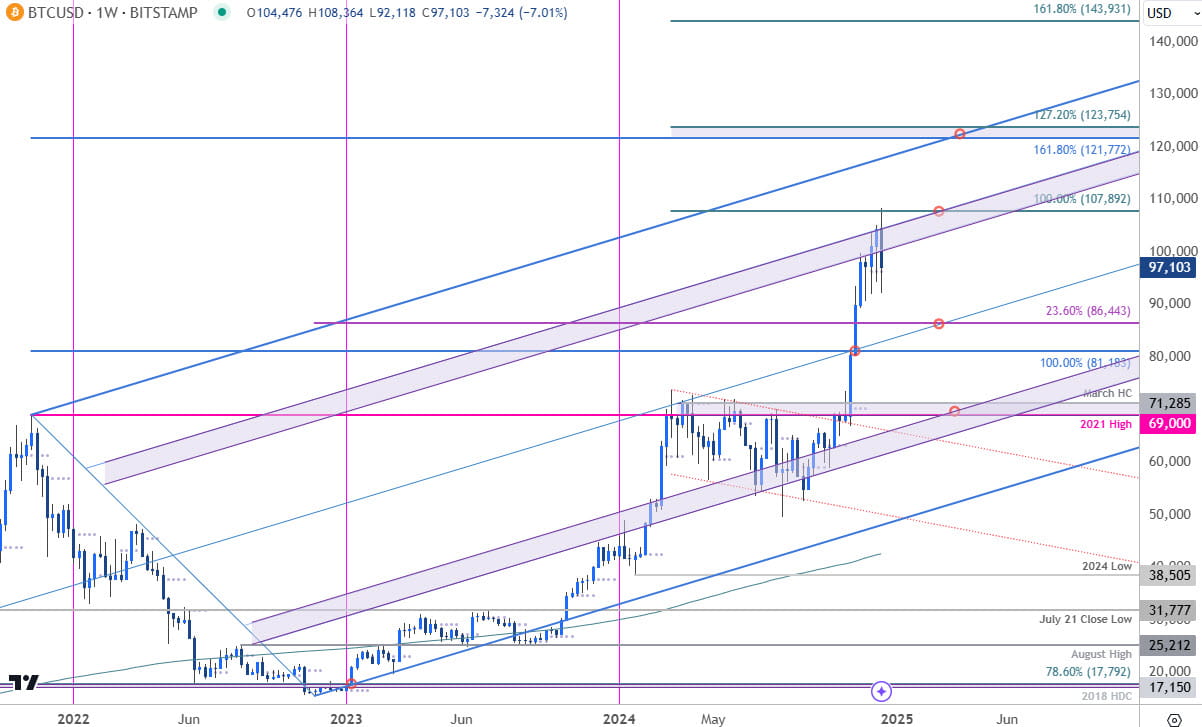
Bitcoin Price Chart- BTC/USD Weekly

Chart Prepared by Michael Boutros, Sr. Technical Strategist; Bitcoin on TradingView
For Bitcoin, the impact was immediate with BTC/USD breaking to fresh record highs the day after the U.S. elections. The subsequent rally extended more than 118% off the August low before exhausting in late December into uptrend resistance. An outside weekly-reversal just ahead of Christmas threatens some near-term weakness within the broader uptrend.
Initial weekly support rests with the 23.6% retracement the 2022 rally at 86,443 and is backed closely by the 100% extension of the 2019 advance at 81,183. Broader bullish invalidation is now raised to the 2021 swing-high / March high-close (HC) at 69,000-71,285- losses below this threshold would suggest a more significant high was registered / a larger trend reversal is underway.
Weekly resistance is eyed with the 100% extension of the March channel breakout at 107,892 and is backed 121,772-123,754- a region defined by the 1.618% and 1.272% extensions. Note that the upper parallel of the ascending pitchfork we’ve been tracking off the 2022 lows also converges on this threshold and further highlights the technical significance of this zone- look for a larger reaction there IF reached with a breach / close above needed to fuel the next move towards he 1.618% extension at 143,931.
Bottom line: The Bitcoin rally is responding to uptrend resistance into the close of the year. From a trading standpoint, losses should be limited to 69,000 IF price is heading higher on this stretch with a close above the upper parallel ultimately needed to fuel the next major leg of the advance.
Written by Michael Boutros, Sr Technical Strategist
Follow Michael on X @MBForex


