200-Day Moving Average Summary
This is a follow-up to our previously published educational article on the topic of the 200-day moving average. We’re fast approaching a heavy batch of headline risk with the European Central Bank, US Core PCE and the FOMC rate decision all scheduled for the next week, and several major FX markets have shown inflections or reactions at their 200-day moving averages. Below I look deeper into the dynamic between the US Dollar and EUR/USD. The next week of drivers could potentially lead to fresh trends and the 200DMA can help traders to see the big picture behind those dynamics. Below we extend the discussion from last week’s webinar when many of these points on the chart began to come into play.
US Dollar
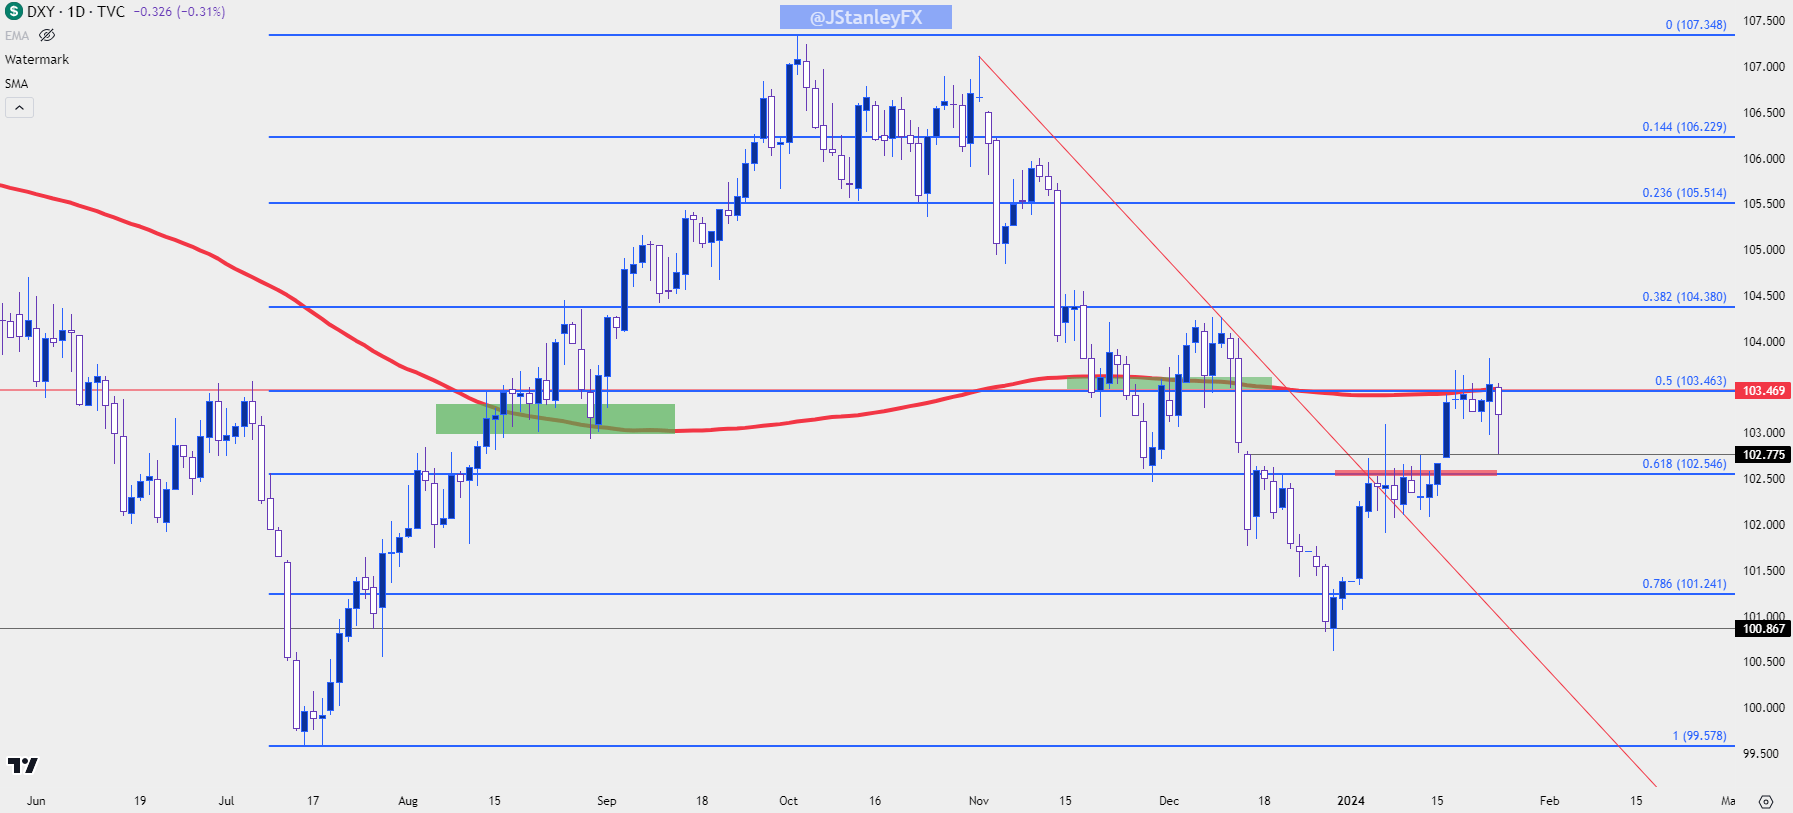
The US Dollar has held resistance at the 200-day moving average for six of the past seven days. While the greenback was burning lower in late-December trade, a V-shaped reversal developed around the 2024 open that pushed price up to the Fibonacci level at 102.55. We looked at that in the first webinar of the year, after which bulls showed up at a higher-low to push price up to the next spot of resistance around 103.50. There’s quite a bit going on there, including a Fibonacci level that’s part of the same study as the 102.55 level. This was also the yearly open for 2023 and of course, the current home of the 200-day moving average.
That has since helped to stall price but as I said in last week’s webinar, the big item of importance is when or where bulls show up for support. Would they show up before a re-test of support at prior resistance at 102.55? So far, that’s been the case. The next few days should add some color behind the matter as we work through multiple drivers.
As shared in the webinar, there remains scope for bullish USD continuation, but bulls would need to hold higher-lows above the 102.00 area and, ideally, the 102.55 area of prior resistance. This could have a large push from the ECB meeting tomorrow where Christine Lagarde has so far avoided the topic of rate cuts, which has kept the Euro as relatively strong. And given the Euro’s massive 57.6% allocation into DXY, that could have a noticeable push, in either direction, based on how well she can evade the topic of rate cuts.
US Dollar Daily Price Chart (indicative)
 Chart prepared by James Stanley; data derived from Tradingview
EUR/USD
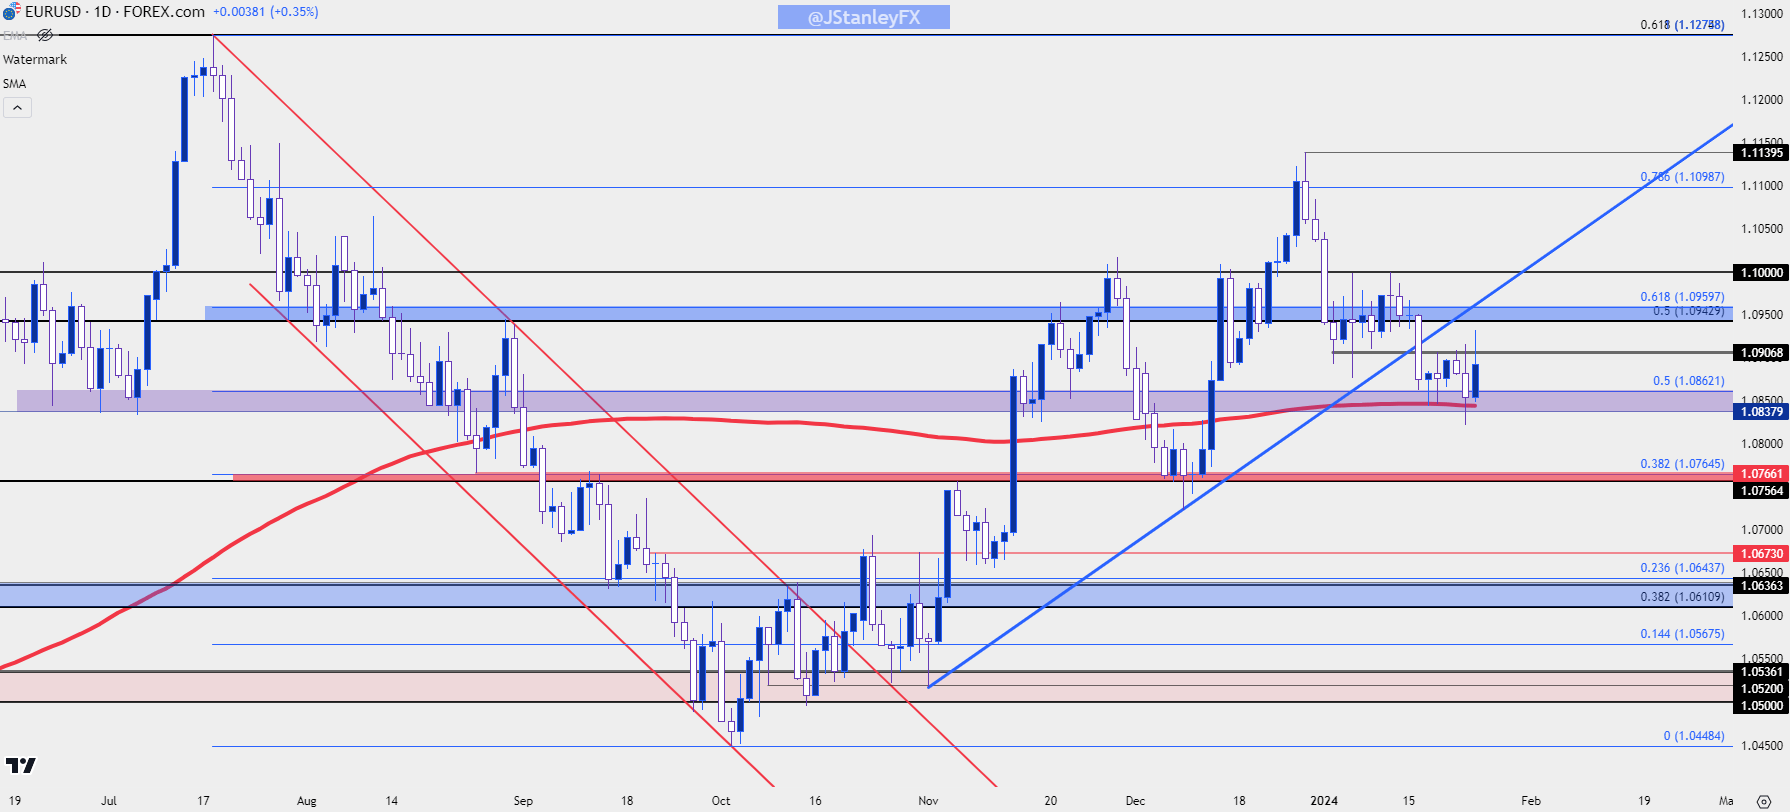
EUR/USD has similarly been testing its 200-day moving average and yesterday saw bears take a shot at a downside breakout. It couldn’t hold, however, as the daily bar ended up closing back-above the 200DMA and this suggests the possibility of a deeper pullback in the bearish move. The 1.1000 level is of importance as this has held two separate inflections so far in 2024 trade; but there’s also a zone of interest between two Fibonacci levels at 1.0943 and 1.0960 that could set up a lower-high. If that lower-high holds, particularly if it’s able to hold through tomorrow’s ECB and/or the Friday US PCE release, the door could remain open for bears as we move into FOMC week.
EUR/USD Daily Price Chart
 Chart prepared by James Stanley, EUR/USD on Tradingview
USD/JPY
I remain of the mind that USD/JPY will continue to trade like an amplified USD. This could be particularly attractive in backdrops of USD-weakness, where a falling USD could prod fears of carry unwind. And if carry unwind begins aggressively the trend could be forceful, such as we saw in Q4 of 2022 or, more briefly, in Q4 of last year.
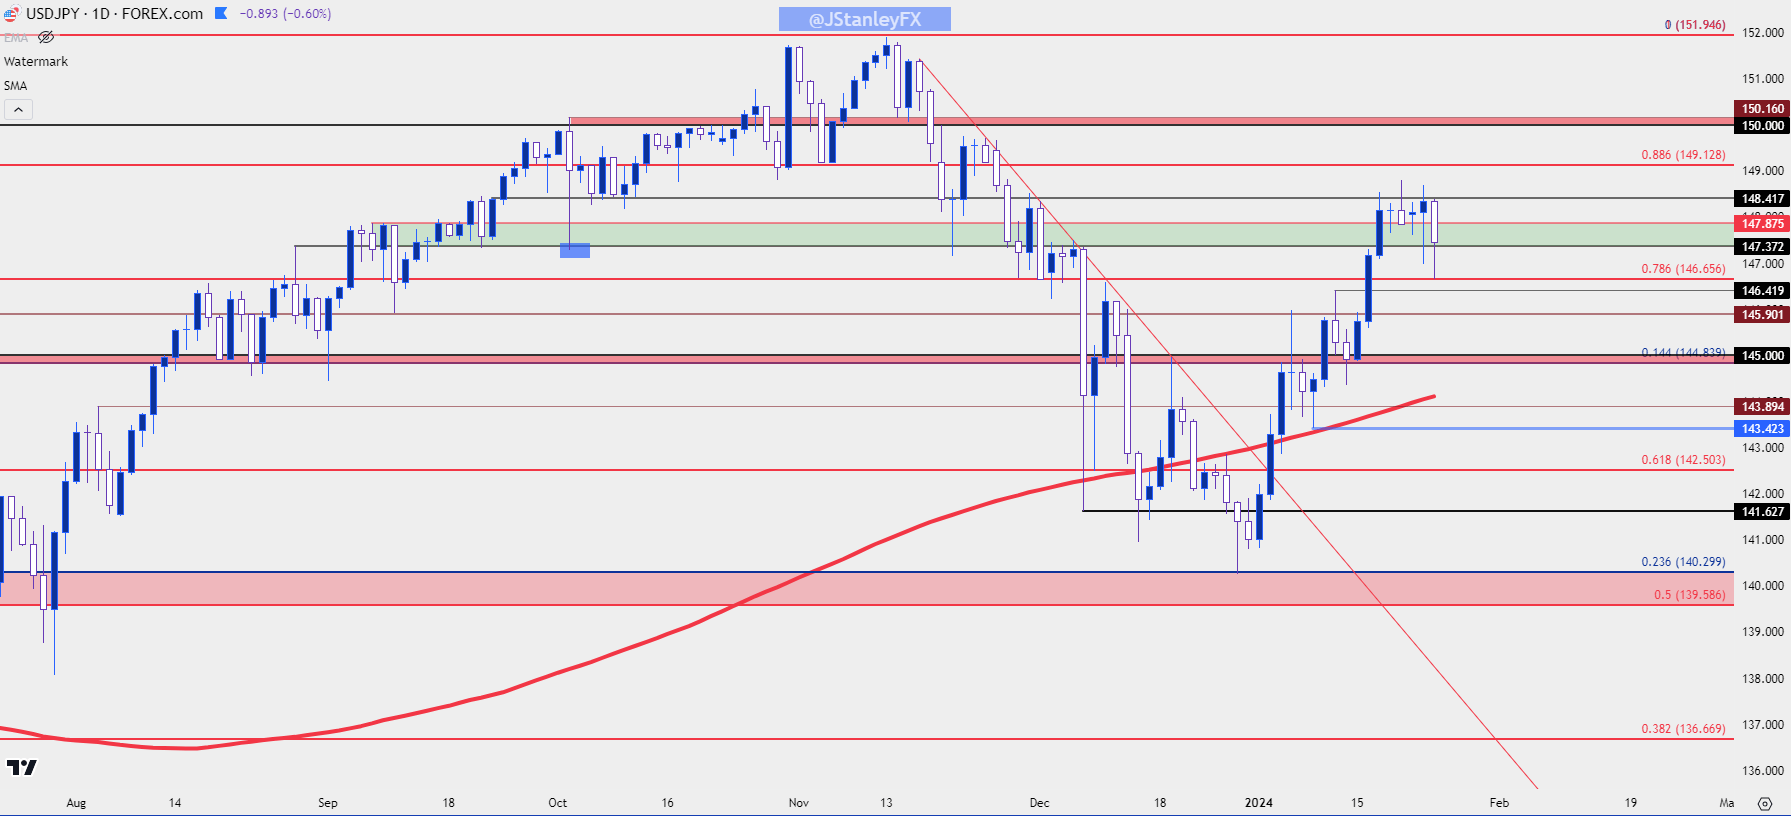
In USD/JPY, some key levels remain in-play. The 148.42 level looked at previously has held the high over the past week. Sellers took a swing earlier today but ran into a big level of support at the Fibonacci level of 146.66.
I think the natural force here remains higher given the still wide rollover on the long side, but if there’s fear of principal losses that can change very quickly. Powell has seemed overly-dovish to me over the past couple of meetings, especially considering the data, but I doubt that this is a mistake as he’s had a tendency to be very careful with his dialog. If he retains that dovish stance, and if Lagarde can hold the line on rate cut talk while essentially avoiding the topic of when it might begin in Europe, then there could be a case for USD-weakness which could then motivate carry unwind.
As for the longer-term trend, the 200DMA appears important. There was a lower-high bounce on January 9th and price has continued to drive above the 200-day moving average since. If sellers can pose another test below, particularly after a lower-high inside of the 150.00 level, the longer-term prospect of reversal could grow more attractive.
USD/JPY Daily Price Chart
 Chart prepared by James Stanley, USD/JPY on Tradingview
AUD/USD
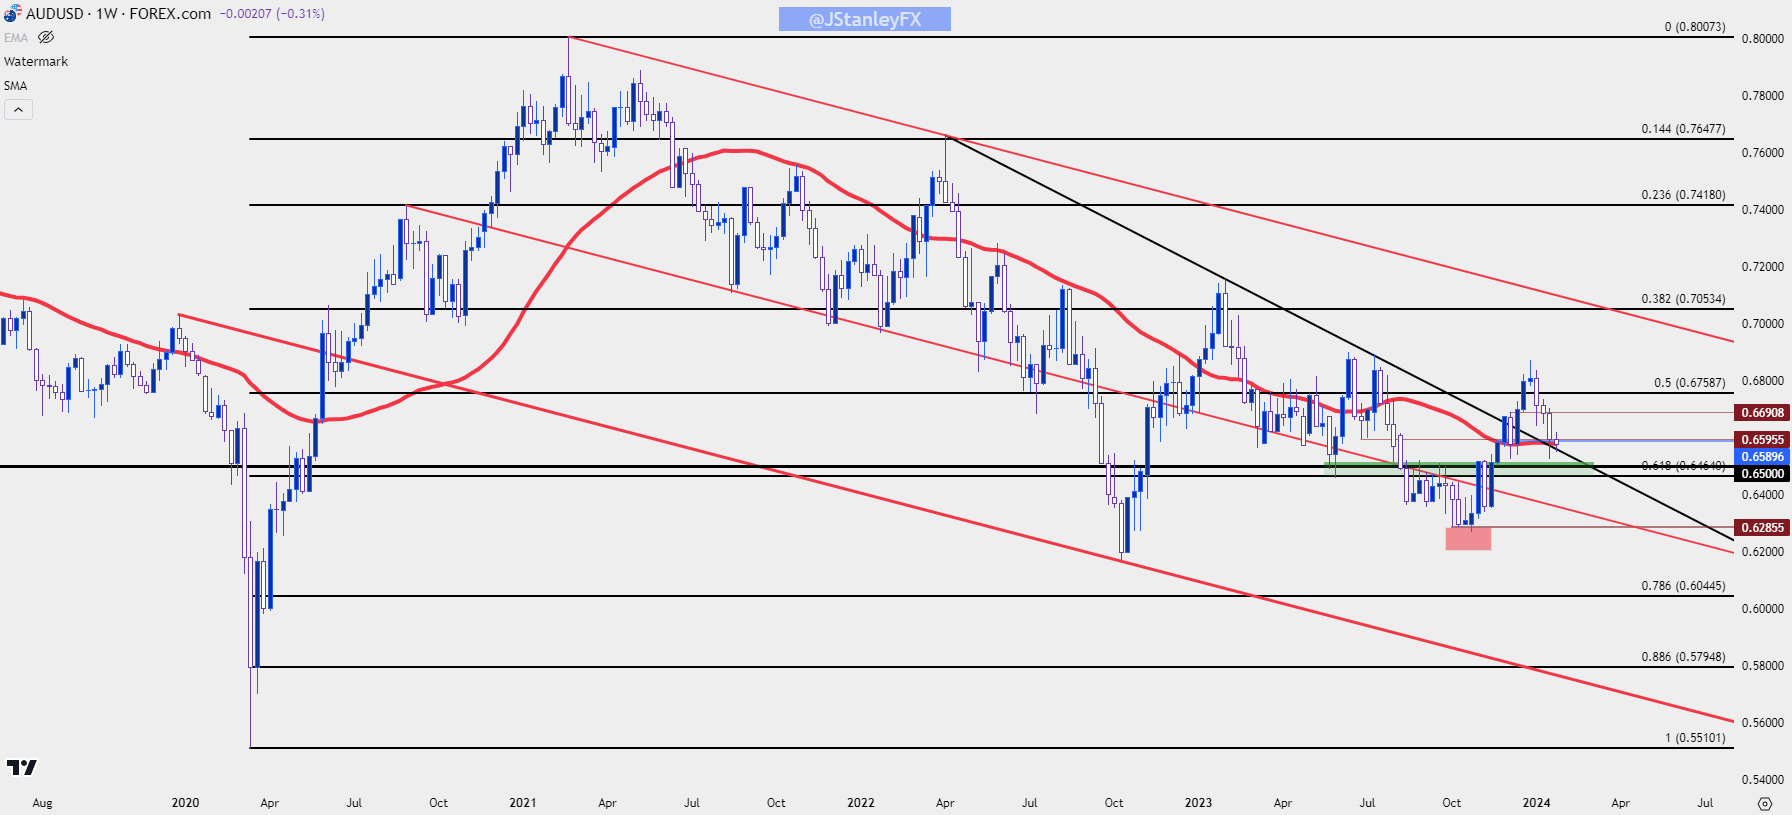
I looked into Aussie last week as price was plunging towards a re-test of its own 200-day moving average. The low came into play a day later and since then there’s been a show of support above the .6500 level. But, as noted in that article, there’s been a tendency for longer-term support to hold around the .6300 level.
The bounce over the past week hasn’t exactly been able to run free to fresh highs, however, as sellers have continued to defend the .6600 level. From the weekly chart below, we can see the mass of confluent that’s currently in-play around support. From the webinar, as I had shared there could be the prospect of near-term bearish momentum, particularly if a test below the .6500 handle comes into the picture. But, longer-term, if bears are unable to create much significant drive below that level there could be a case to be made for bigger picture support coming into play.
AUD/USD Weekly Price Chart
 Chart prepared by James Stanley, AUD/USD on Tradingview
--- written by James Stanley, Senior Strategist


