Our view is unchanged from a week ago when we wrote: “Gold is overbought at $2,000 and needs to correct, but the medium-term range should remain unchanged with support at $1,900, while the upside is probably favored in the medium-term.” Gold is still likely to hold in its current range, and silver is expected to continue to underperform, especially with so many COMEX silver shorts now closed out. We’ve seen some producers selling. Silver is tempting at these levels.
Gold in key currencies

Source: Bloomberg, StoneX
Gold is consolidating and building a base for further gains, subject to geopolitics. The hue and cry a couple of weeks ago when gold bounced up as of 7th October was a bit overdone. Gold was returning to its comfort zone of $1,950-1,990 after a bout of weakness.
A change of “big figure” is always of psychological interest, so the challenge of $2,000 was bound to attract attention, but it is of no technical significance. From a technical standpoint, gold is overbought in US dollar terms on the Relative Strength Index (RSI) and getting that way on the Bollinger basis—overbought in Swiss francs, Yen, and Euro terms, and very much so in Thai baht and Korean Won (we would expect physical metal to return from those areas.)
On a supportive basis, the 20-day moving average is crossing above the 50-day as we write, which is a bullish signal. In the short term, technical factors should be more extended. Still, they are constructive for the slightly extended period as the key moving averages are all below the spot price and trending higher—time for a breather.
Gold’s technical considerations

Source: Bloomberg, StoneX
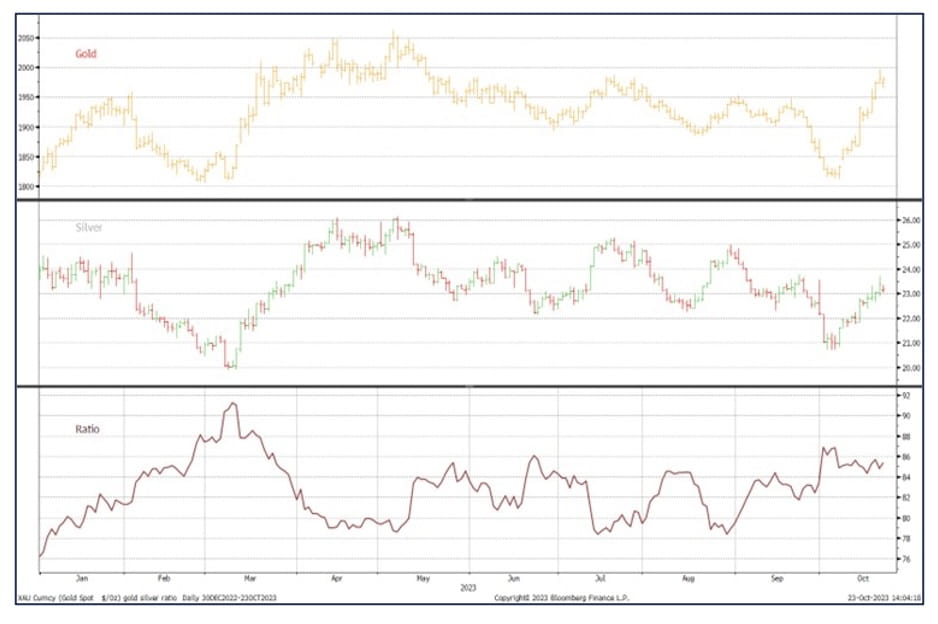
Silver has continued to underperform gold, moving higher on gold’s coattails but also reflecting that most demand is industrial, and growth remains threatened. Since the markets’ recent lows of 6th October, gold has rallied by 9.6% and silver by “just” 10.2%.
Silver typically moves twice as far as gold, if not more, on this specific basis; this is a notable underperformance. While the industrial element goes a long way towards explaining this, silver’s reluctance to move underscores that while investors are hedging against risk, the momentum to take gold into a new higher range is still not there, or silver would be more aggressively bullish.
Gold, silver, and the ratio

Source: Bloomberg, StoneX
In the background, there have been reports of some producers selling, which is not surprising given the price action. Interest rates are also a key here. The chart below shows that the five-year yield was 1.16% two years ago. Now, it is 4.8%, and with the Fed most likely to be putting its rate cycle on pause, the gold contango on top of high spot prices must make it very tempting to lock in some forward prices. As of this morning, 30th October, five-year forward gold is $2,385.
Gold forward curve; live, two- years and five years ago

Source: Bloomberg, StoneX
Something similar may be happening in silver, although the forward curve profiles are different from gold in that two years ago, the shorter tenors were higher than they are now. Remember that only 27% of silver mine production is from primary silver mines, and the rest is a base metal by-product. With copper, lead, and zinc all still struggling (especially zinc), the prospect of locking in good silver by-product credits must also be very enticing.
Silver forward curve; live, two- years and five years ago

Source: Bloomberg, StoneX
Futures positions
On COMEX, there was more long-side positioning in gold and some chunky short-covering, with longs adding 55 tonnes or 14% and shorts contracting by 71 tonnes or 34%. This takes the net long to 173 tonnes, the highest since mid-August, while the outright longs, at 381 tonnes, are the highest since early August and 6% above the twelve-month average.
Silver was a different story, with its underperformance prompting and reflected in further long liquidation (227 tonnes or 5%). Still, some heavy short-covering (always a wise move, as silver short-covering rallies can be very vicious), taking 856 tonnes or 24% out of the position to 3,597 tonnes, down 67% since the recent peak of 5,601 tonnes – which was only a fortnight previously. The net long thus rose from 535 tonnes to 1,164 tonnes over the week.
Gold COMEX positioning, Money Managers (tonnes)

Source: CFTC, StoneX
COMEX Managed Money Silver Positioning (tonnes)

Source: CFTC, StoneX
Exchange Traded Products
In the ETP sector, there has been scattered buying in gold, taking the days of net creations in October for six out of 20 trading days. This included over 14 tonnes going in on the day that gold first challenged $2,000 (20th October), but generally, there has been continued light selling for a net reduction of 38 tonnes in the month and 231 tonnes year-to-date, to stand at 3,242 tonnes. Global mine production is roughly 3,700 tonnes per annum.
Silver has been similar, with some scattered buying leading to a minimal net gain in the month-to-date of 30 tonnes and a loss year-to-date of 1,055 tonnes to stand at 22,240 tonnes. Global mine production is approximately 27,000 tonnes per annum.
Taken from analysis by Rhona O’Connell, Head of Commodity Market Analysis for EMEA & Asia, StoneX Financial Ltd.
Contact: [email protected].


