Technical Analysis Talking Points:
- This article takes a big picture look at technical analysis and its function for traders.
- Up-front, technical analysis is not perfectly predictive. But the same goes for any other form of analysis: It’s just analysis, or a way of looking at something, and the past does not predict the future. But technical analysis can be helpful with risk management, which is a necessary component for traders navigating a constantly-uncertain road ahead.
- This article is built around the second module of the Trader’s Course, which is a six-part series designed to teach trading in a palatable format. To learn more about the course, please click on the link below:
In the opening of The Trader’s Course, I tried to address the topic head-on even though the topic for the module was Fundamental Analysis: Risk management is a necessity for anyone hoping for consistent success in markets. I know from experience that this usually isn’t what a new trader wants to hear. Instead, they want short cuts or ‘can’t miss’ strategy ideas: What’s the best indicator? What’s the best time frame? Which market is most profitable? How can I ‘use the news’ to maximize profit potential?
This isn’t something that I can address as an objective fact as there are too many variables to produce any type of realistic statistic, but I’d be happy to offer my opinion on the matter and, hopefully, appeal to your logic: There are no ‘holy grails.’ Short cuts are likely to cause more burn out or dead-ends, and every strategy, at some point, faces failure. As a matter of fact, trading is one of the few fields one can embark on where failure is practically guaranteed, and this fact holds for everyone navigating across markets, from fund managers with hundreds of billions in AUM to you and me, clicking prices on the screen.
At all points in time the future remains unpredictable, and this premise exists with any form of analysis. This is a hard fact that you should already know, as fortune-telling crystal balls do not exist. Anyone saying otherwise or indicating something else should cause you to think critically about why they’re saying what they’re saying. Unfortunately, as is the case with the internet, there’s often a sales pitch somewhere around there. And your critical thinking should then extend to the very rational next question of: ‘If this person has a strategy that accurately predicts the future which could conceivably print money for them, why are they offering to sell it to me for just $199.99 per month?’
Again, I’m not the guy that has answers to every conundrum, but the very basic quandary should cause you to question why anyone would claim to do something that you know probably can’t be done. After being in markets for more than 20 years, hearing advertisements a ‘can’t miss’ strategy or a 90-95% win rate is how I imagine most people would react if a random stranger told them that they could fly. ‘Ok, sure, good luck with that.’
On top of that, even a 99%-win ratio can be a failure, as we’ll look at a little later in this article.
But – just because perfect prediction is impossible, it doesn’t mean that consistently profitable trading is an unreachable goal. After all, there’s an entire industry of hedge funds and money management firms built on the prospect or goal of producing Alpha for their investors. And they probably aren’t utilizing a crystal ball or a set of tarot cards as their primary source of strategy ideas…
Below, I’m including the direct link for the second module of the Trader’s Course that covers Technical Analysis. This is completely open and free, and you’re welcome to view it right from the video player. There’s more to the course, with Price Action as the third module, and then Trading Strategy as the fourth, Risk Management as the fifth and the ever-important Trading Psychology as the sixth and final installment. Below the video player, I further elaborate on the topic at hand.
The Trader's Course, Module 2: Technical Analysis
‘Technical Analysis Doesn’t Work’
I want to address this up-front because I see the phrase so commonly spewed on social media. And I somewhat agree with it, to the effect that the past will not perfectly predict what will happen in the future. But the entire premise of the phrase is incorrect. Technical analysis does not work, because it doesn’t have a job. It’s simply a form of analysis, a way of looking at something. And technical analysis is almost entirely based on the past which, again, does not accurately predict the future and the reason why is logical – because new ‘stuff’ happens all the time. This is what makes life fun and exciting, even if a little bit scary, at times.
While the field of technical analysis does not have a job, the trader does, and that job is to manage risk (because, again, the future is uncertain). And for risk management, technical analysis can be quite helpful as it’s one of the few ways that a trader can incorporate data in effort of making sound decisions.
But, perhaps more attractively, technical analysis can open the door to asymmetric opportunity. For the new traders looking for holy grails, that might not sound very exciting, but the ability to earn two or three dollars for every dollar risked is something that will typically excite experienced traders. Because most experienced traders have already fallen into the ‘prediction trap’ where they see that asymmetry working in the opposite direction, with one ‘bad’ trade wreaking havoc on their trading account and wiping out the gain from numerous smaller winners. And, in some cases, causing full-scale devastation of their efforts for just one or two really bad trades.
‘The Prediction Trap’
As a thought experiment, imagine a trader using a one pip limit and a 100 pip stop. This trader is probably going to feel good most of the time as a one pip limit will probably be hit quite often. And with each win, a small dopamine hit arrives as a reward. But it just takes one instance out of 100 for the limit not to hit and the trader to see a net loss. I’d expect that to happen more than one out of 100 times which would equate to a terrible equity curve. Even two instances of failure in a 100-trade sequence would equate to a 102 pip loss. But, even if it happened only once, they’d still be looking at a losing equity curve even with a 99% win rate.
But, still, this trader would probably feel good the majority of the time with a 98% win rate, even though they were losing money on net and the totality of their efforts could be classified as failure. The table below highlights this simple math, without including any slippage or commissions or anything else.
For the trader that’s chasing dopamine, this might not ‘feel’ like a terrible strategy as they’re walking away feeling victorious 98 or 99% of the time. But, as you can see below, math matters.

Image prepared by James Stanley
And for many traders without a plan or without a risk management approach, they may fall in a similar trap of using wide stops and narrow limits, hoping to ‘beat the market’ the majority of the time, focusing solely on winning percentage and expecting profitability to follow.
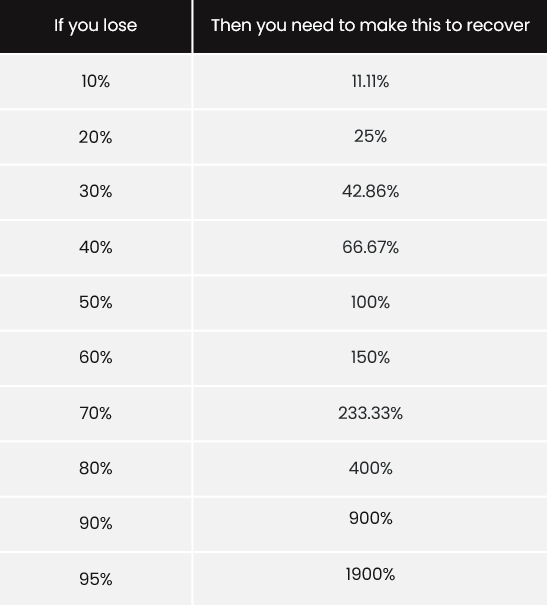
The unfortunate truth is that math is not a trader’s friend in that arrangement: I call this ‘trader math,’ as large losses require even larger gains just to get back to where they were. And break-even is pretty important to traders as this is what qualifies profitable or not.
I addressed this in the first few slides of the Trader’s Course, in the section for fundamental analysis, because I truly believe that this is more important than any analytical system or technical strategy. Because if one loss wipes out 25% of your account, you now need to make 33% just to get back to where you had started. If you lose 50% of your account, well now you need to double your remaining account value just to get back to that prior point.
And if a trader just took a 50% hit, then a 100% return probably doesn’t seem very likely. The math gets more difficult the larger the loss and a trader that’s lost 80% of their account now needs to quadruple their remaining balance, with an eye watering 400% return - just to get back to break-even. As you can imagine this will probably feel like a fruitless effort, and that’s the point where many decide to quit. And really it was probably rooted from just a couple of bad trades that went awry because that trader wanted to win so badly.
Lose the Battle to Try to Win the War
This is the math of gains and losses and it’s a very slippery slope. This is why risk management is necessary because before a trader can find consistent profitability – they have to be able to control or stem the bleeding from the inevitable scenarios when they are wrong. Or else, they can quickly fall prey to the prediction trap where one bad trade wipes out the gains from numerous winners while also eating away at their account equity.
Trader Math: The Math of Gains and Losses, a Slippery Slope

Image prepared by James Stanley, taken from The Trader’s Course
History May not Repeat, but it Can Rhyme
So, how can the past help a trader avoid the slippery slope of trader math? By limiting risk. It allows traders to insert simple if-then statements: If the trend continues, I can be in position to manage a winning trade. But if it doesn’t, I can mitigate the loss before it makes an unmanageable dent in my trading account.
But this also comes with the acknowledgement that traders will be wrong, at times, and rather than waste account equity hoping to be right, they can instead take a small loss and re-employ their capital elsewhere.
The basics of technical analysis are trend identification and support and resistance. Trends are important because this is a market bias, and it usually happens for a reason (which can often be explained by fundamentals, although that, too, is hindsight). Now that bias may not continue but it’s also possible that it could, and this provides something usable for traders in providing possible direction for trade setups.
Support and resistance are important because this is like a past road map of market behaviors, showing prices that have had or may tend to draw fresh buyers or sellers into a market. And this is where traders can look to place stops or limits so that if what has happened continues to happen, they can be in position to manage a winning trade. But – if something changes – they can get out of the trade relatively early in effort of avoiding a larger loss and falling down the slippery slope of the prediction trap.
Between trend identification and support and resistance, traders can gain some helpful information when looking to impart strategy. They can combine this with some basic fundamental analysis, which can help to validate trends by giving a reason for their existence. And support and resistance become helpful keys on the path to trading those trends, as traders can then look to buy support in up-trends while selling resistance in down-trends.
The attractiveness of this simple approach to the market is that traders can focus on one of the few things that they do have control of – their risk and reward, with the possibility of asymmetric gains when right and smaller losses when wrong.
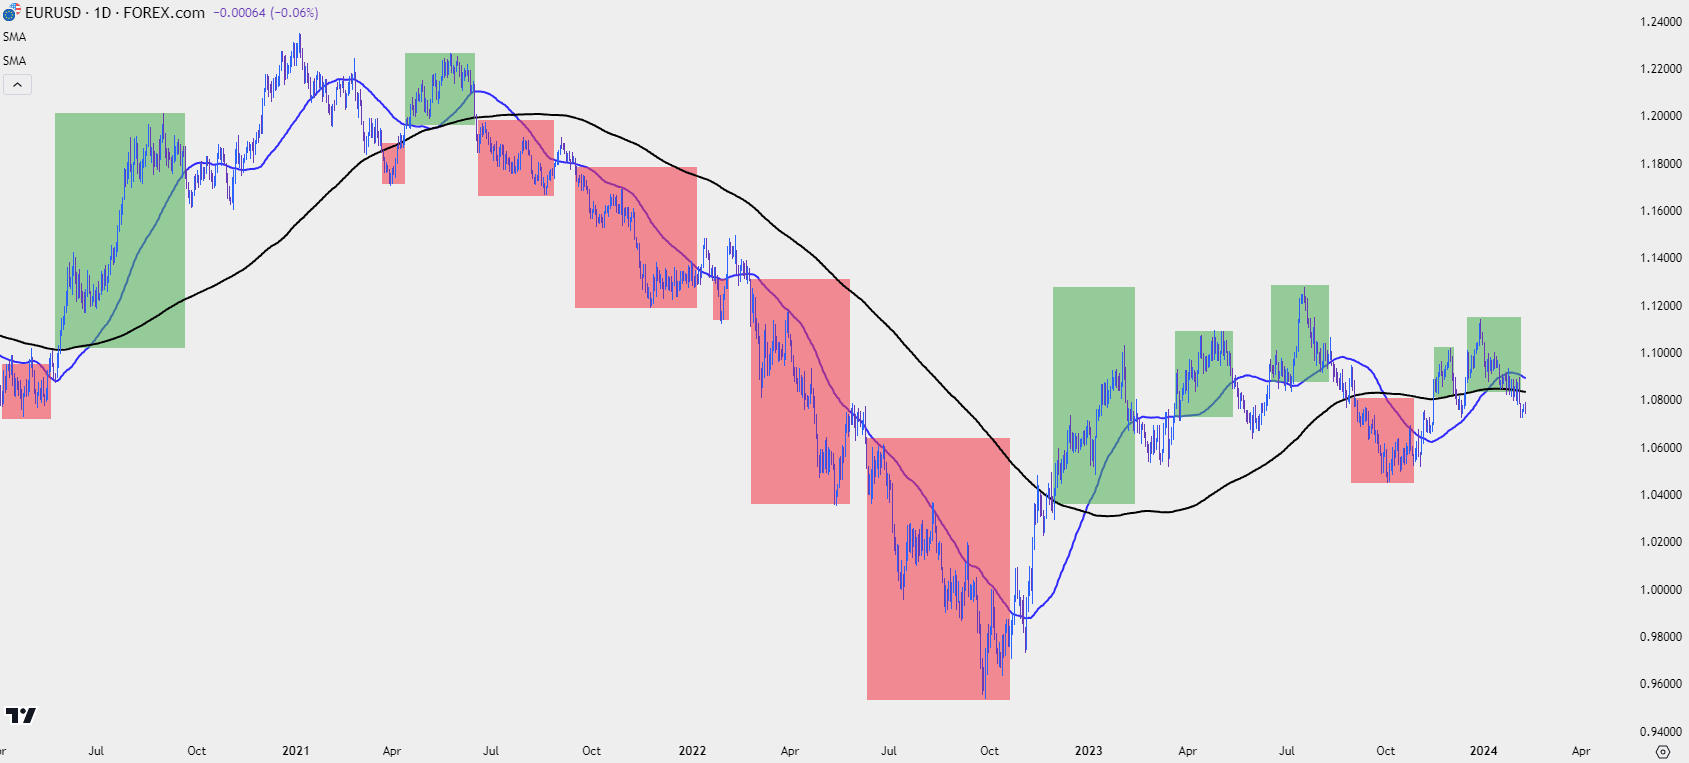
EUR/USD Daily: Death Cross, Golden Cross as Trend Filter
 Chart prepared by James Stanley, image from 3 Ways to Use a Moving Average in a Trading Strategy
How to Incorporate Technical Analysis
This is what the second module of the Trader’s Course addresses, but we can certainly touch on that here, as well.
Going back to the early part of this article a common next question is ‘what’s the best form of support and resistance’ or ‘what’s the best way to identify trends.’ And there’s a lot of possible answers to this question but again, ‘best,’ is a relative matter and there’s not really an accurate way to address that.
For traders that are trying to find a holy grail they’ll probably be left wanting because no method will be perfect – all will be subject to failure at times, and that’s somewhat of the point. The key is failing small when wrong and winning larger when right.
Moving Averages
Moving averages can be incredibly helpful tools in both trend identification and support and resistance. Many traders will learn this as one of the first waypoints in technical analysis on the way to learning other, more intricate indicators. And once they realize that indicators don’t perfectly predict, there will often be a loss of excitement, with the moving average forgotten by the wayside.
But realistically what should one expect? A moving average is simply the past periods’ closing prices divided by that moving average value. By design – it is lagging the market and that is precisely the point, it’s modulating near-term price behaviors in effort of showing a bigger picture trend. It can help the trader to put into context what this bar’s movement means to the bigger picture trend.
In the course, I utilize moving averages in a few different ways, with highlights looked at in the article Three Ways to Use Moving Averages in a Trading Strategy.
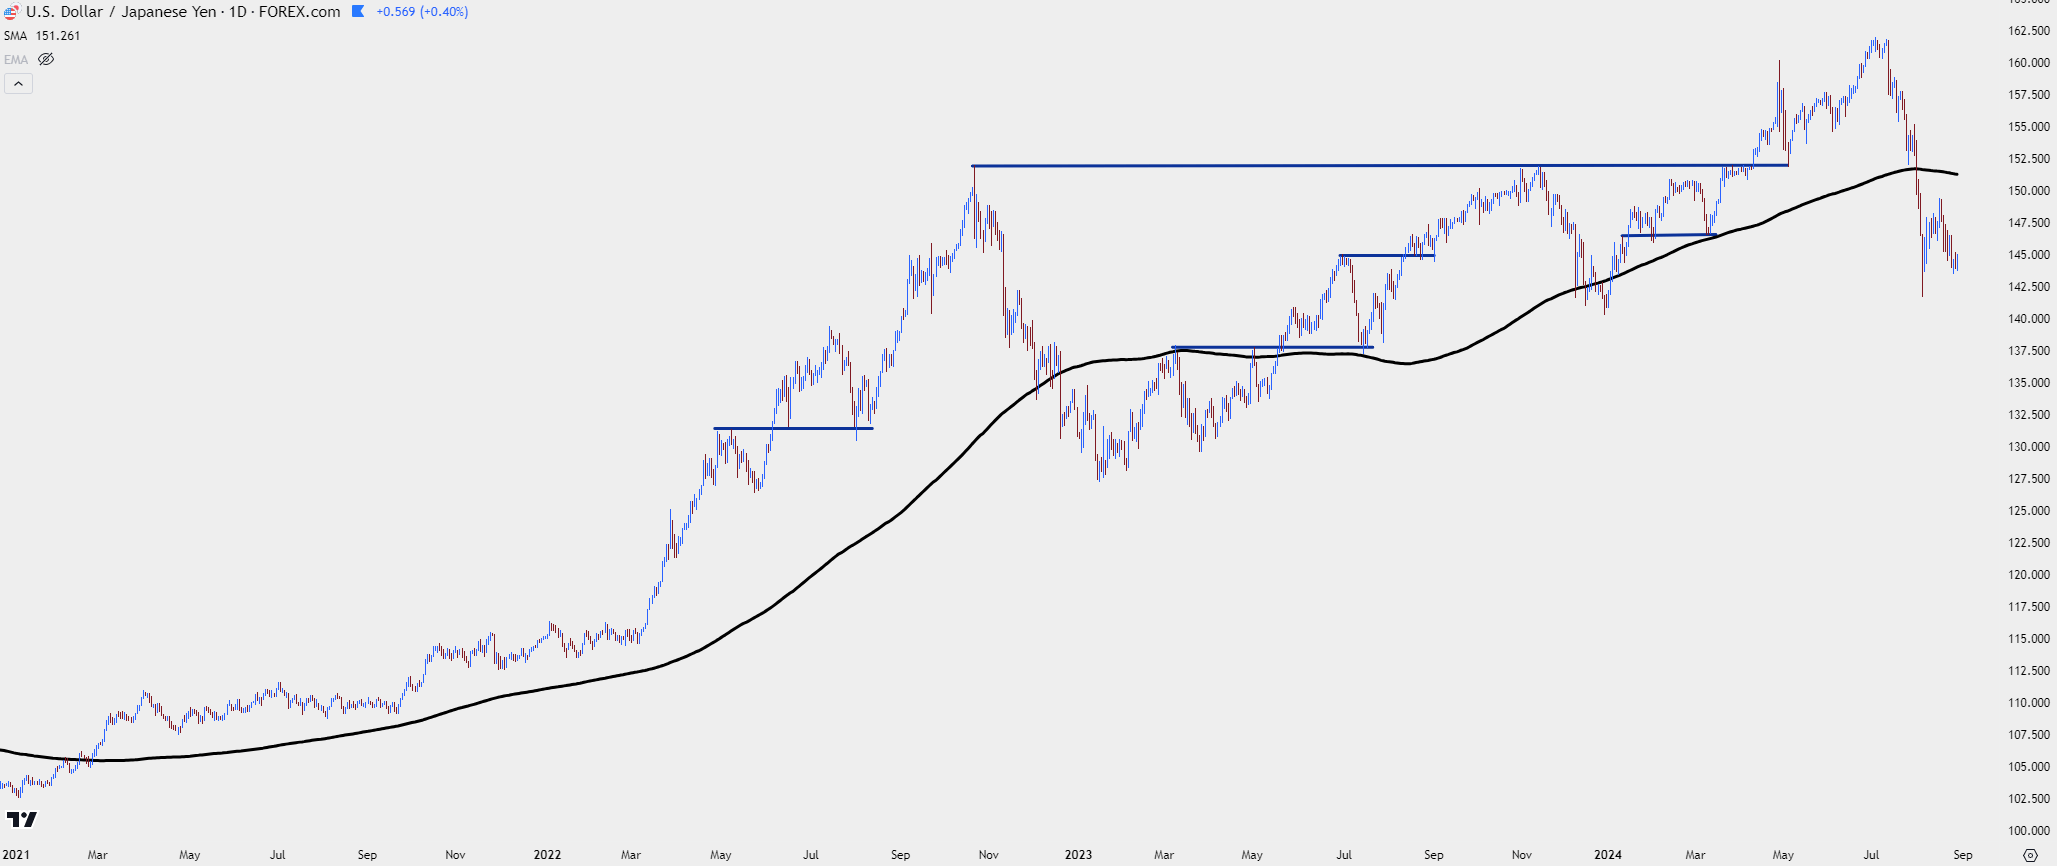
As for specific moving average values, the 200-day moving average is common as a trend identification tool. I wrote about that earlier this year anticipating the 200-dma to be in-play for a number of markets and sure enough, that’s been a big part of 2024 price action across the FX market, so far.
USD/JPY Daily Price Chart: 200-DMA Applied
 Chart prepared by James Stanley, image from TradingView, USD/JPY 2021-August 2024
Price Action
Price action is a popular way for traders to approach technical analysis and with this field of study, no indicators are needed. This is such an important part of my approach to markets that I created an entire module just for this field, and it’s the third section of the Trader’s Course which you’re welcome to check out.
The benefit of price action is in its simplicity; and it aims to reduce the lag that’s ever present with any computed indicator as it takes on more of a relative appeal with markets as opposed to an objective value like a moving average might produce.
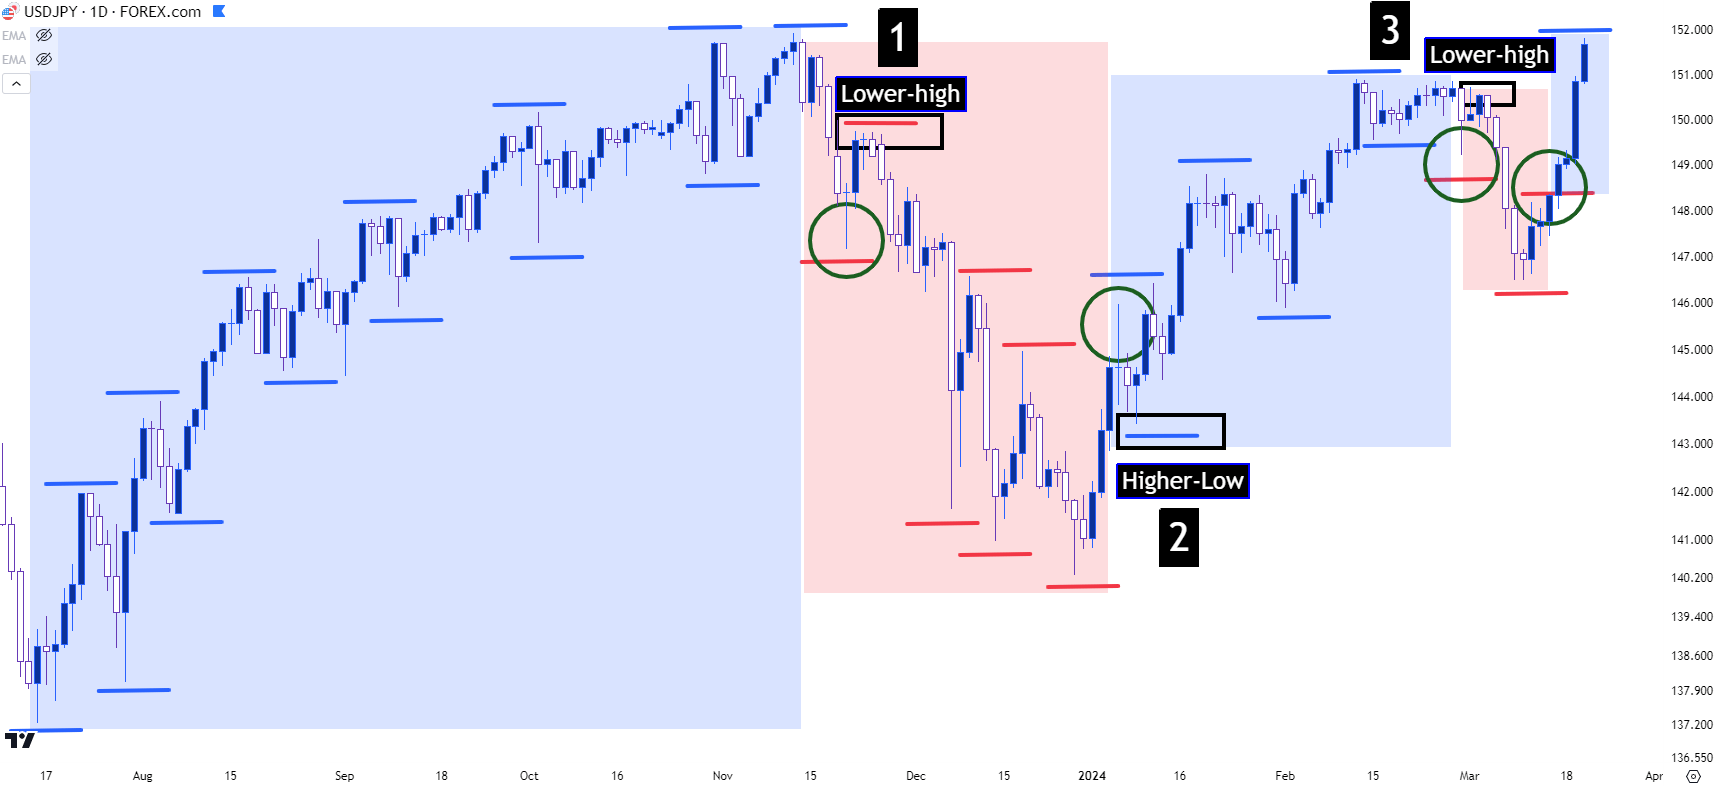
Quite simply, markets often display similar characteristics of other venues of life. Improvements often show in a ‘two steps forward, one step backward’ type of rhythm, and this can be equated to a trend in a market, with bullish backdrops making higher-highs and higher-lows and bearish trends making lower-lows and lower-highs. Traders do not need to rely on an indicator to help identify trends, and I investigated that in the article about Price Action Trends.
Support and resistance can also be identified using price action and there’s also an element of using prior price structure to support new trends. ‘Support at prior resistance,’ or ‘resistance at prior support,’ are both common ways to look at trading new trends, incorporating possible support or resistance from prior price structure. Similarly, the allure here is in the ability to manage risk, so that if the new trend does hold support at a higher-low, which happened to be a prior point of resistance, the trader is able to look for trend continuation with the possibility of a larger gain relative to the size of the stop.
USD/JPY Daily Chart: Price Action Structure
 Chart prepared by James Stanley, image from Price Action Trends
Patterns
Extrapolating from simple price action we can begin to investigate price patterns. This can be considered as a form of technical analysis but the gist is that traders are looking for a format of candlesticks to get an idea for something that may be happening in the future.
Like many other forms of technical analysis, traders will see that not every pattern plays out and then, all of the sudden, the entire field must be a failure!
No. Again – the past does not perfectly predict the future and any assertion otherwise is outlandish. The point of patterns is to seek asymmetry. Smaller risk amounts with larger targets if or when the pattern does succeed. Patterns are simply a more intricate way of trading price action, by looking for specific backdrops as opposed to generalized trend and support/resistance analysis. It can be a simple way for traders to seek setups that carry $2, $3, or $4 dollars of reward potential for each $1 put up to risk.
Deeper with Technical Analysis
We’ve really only been able to scratch the surface in this article and in the second module of the Course, I’m able to dig deeper. But, given the pace of this article along with the subject matter, there’s an important question that should be addressed before we conclude.
If this is all so simple, then why is consistently profitable trading a challenge?
Again, this is a question that’s impossible to address as objective fact so the best I can do is offer my opinion. But I’m of the belief that consistently profitable trading has more to do with psychology, planning and discipline than a trader’s analysis. That, combined with the necessity of patience, are traits that I don’t consider to be common, especially in today’s dopamine-rich culture.
Trading is difficult because failure, at least some of the time, is practically guaranteed. As human beings we often try to limit or minimize that failure as much as we can and this can lead to bad behaviors like the prediction trap, or by letting one trade go awry and wipe out the gains from numerous others. Quite frankly human beings aren’t often equipped to deal with persistent failure without losing motivation or enthusiasm.
And extending that argument, if you look at success in most other venues of life it’s based on frequency. If you ask whether a sports team is successful, you’re probably going to look at their win/loss ratio, or their winning percentage. To pass a class in school, it’s all about how many correct answers you get on a test.
It’s easy to extend this logic into trading where trader’s primary focus becomes winning percentage, and this can even ‘feel’ proper because there’s also the emotional impact. Winning more often feels better while losing more often feels like failure; but, as we saw with risk management, that can be a trap door as the smaller portion of losing trades can far outstrip a larger portion of smaller winners. Chasing dopamine in markets can be a recipe for disaster.
The goal in trading is to make money, not get into the playoffs nor to get a passing score on a test. And, paradoxically, lower winning percentages that focus on asymmetric wins could be the more logical pathway for traders to go. But – that doesn’t mean that it’s going to feel good, and most people struggle to take on painful efforts without some type of assuredness of payoff. And there’s never any guarantees with trading or markets or trend - so that assuredness will remain as evasive and somewhat of a chase, even for consistently profitable traders.
I dig deeper into these topics in the final two sections of the Trader’s Course, and I share what I consider to be a simple way to address each. It’s not ground-breaking nor are there any secrets so I won’t pretend that there is in this article, but it’s basic planning and discipline which is what I extrapolate on in the risk management and trading psychology modules.
--- written by James Stanley, Senior Strategist


