
US Dollar Talking Points:
- It’s been a big week across macro markets and the US Dollar has continued to hold resistance at the 200-day moving average, even as tech stocks took a bearish turn. The USD move is somewhat impressive considering the USD/JPY sell-off, which drove fears of carry unwind causing a stronger sell-off in tech stocks.
- Next week is loaded with headline risk as we get earnings from four of the Mag 7 and the FOMC rate decision on Wednesday will be widely-watched. The bank is currently expected to cut rates at their final three meetings of the year surrounding the election, which means next week would be when Powell and the Fed would lay the groundwork for the first cut of this cycle in September.
- I’ll be discussing these themes in-depth in the weekly webinar. It’s free for all to register: Click here to register.
Stocks were hammered this week after the Tuesday earnings calls from Tesla and Google. Both companies have heavy AI-exposure and, particularly for the latter, there remains questions as to how they’ll actually make money with it. At Tesla, Full Self Driving presents a very logical usage of Artificial Intelligence but their attention is looking ahead to robotics and implementing AI via their Optimus platform, which CEO Elon Musk expects to be in production in 2025.
The response across equity markets on Wednesday was brutal and it didn’t take long to see headlines declaring that the AI bubble was popping. As I shared in the video yesterday, it’s far too early to make that claim and next week will be a big decision point on the matter: The middle of the week is action packed as we hear from Microsoft on Tuesday (more on that in a bit) with META on Wednesday; followed by Apple and Amazon on Thursday.
And perhaps more importantly, there’s a FOMC rate decision on Wednesday and market expectations are very dovish at the moment, expecting the Fed to cut 25 bps at the final three meetings of the year surrounding the election. If that’s the case, it would mean that next week would be important for Powell and the Fed to highlight the likelihood of a cut at the September meeting six weeks later.
As of this writing, there is a 0% probability of no rate cuts by the end of the September meeting. There’s a higher chance at 0.4% of 75 bps of cuts than there is for no cuts at all. This can change, of course, but it highlights the current expectation for an extremely-dovish Federal Reserve.
Rate Probabilities for Sept. 18, 2024 FOMC Rate Decision
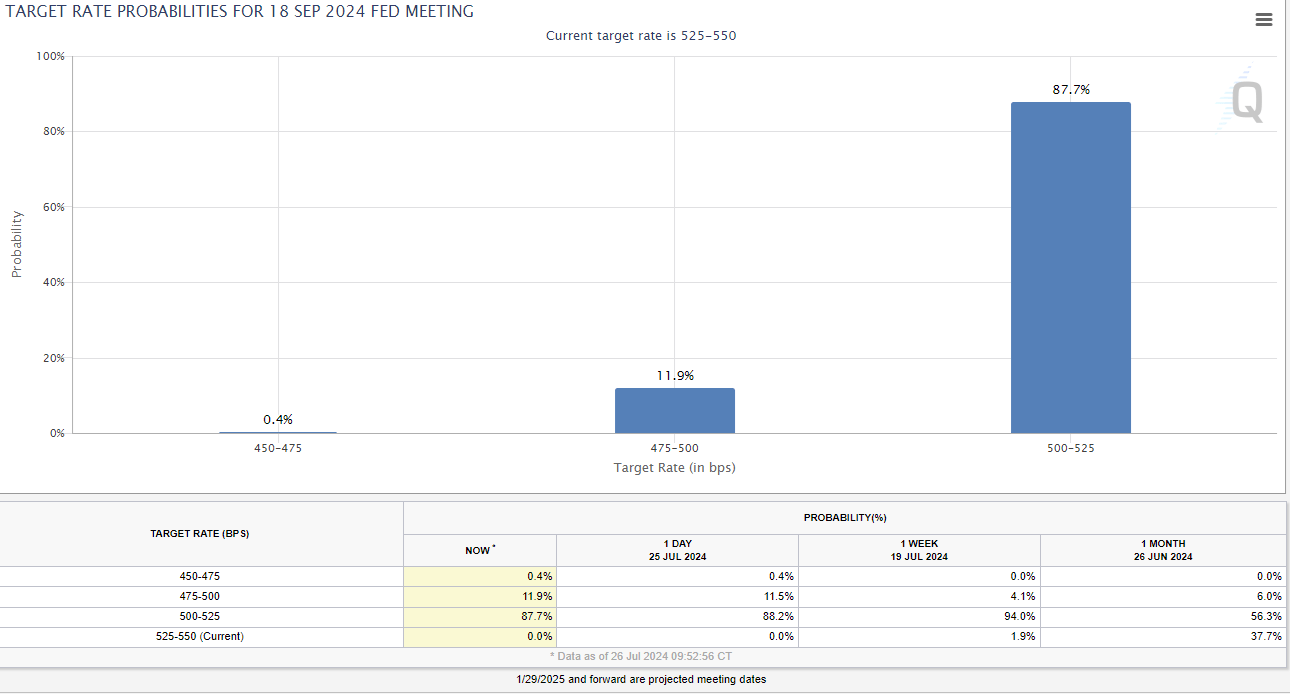 Chart prepared by James Stanley; data derived from Tradingview
USD/JPY
This was another notable item as USD/JPY put in a strong reversion of the longer-term trend. With the carry trade driving for the past three years. With the pullback in USD/JPY appearing at the same time as the sell-off in tech stocks, there were a number of links that were made.
If we look at price action in Nasdaq and S&P 500 Futures overlaid on USD/JPY since the US CPI report on the 11th, there’s been a relationship of note and this led to the conclusion that unwinding carry was a contributing factor in the sell-off in US tech stocks.
USD/JPY with NQ and ES: Four-Hour Chart
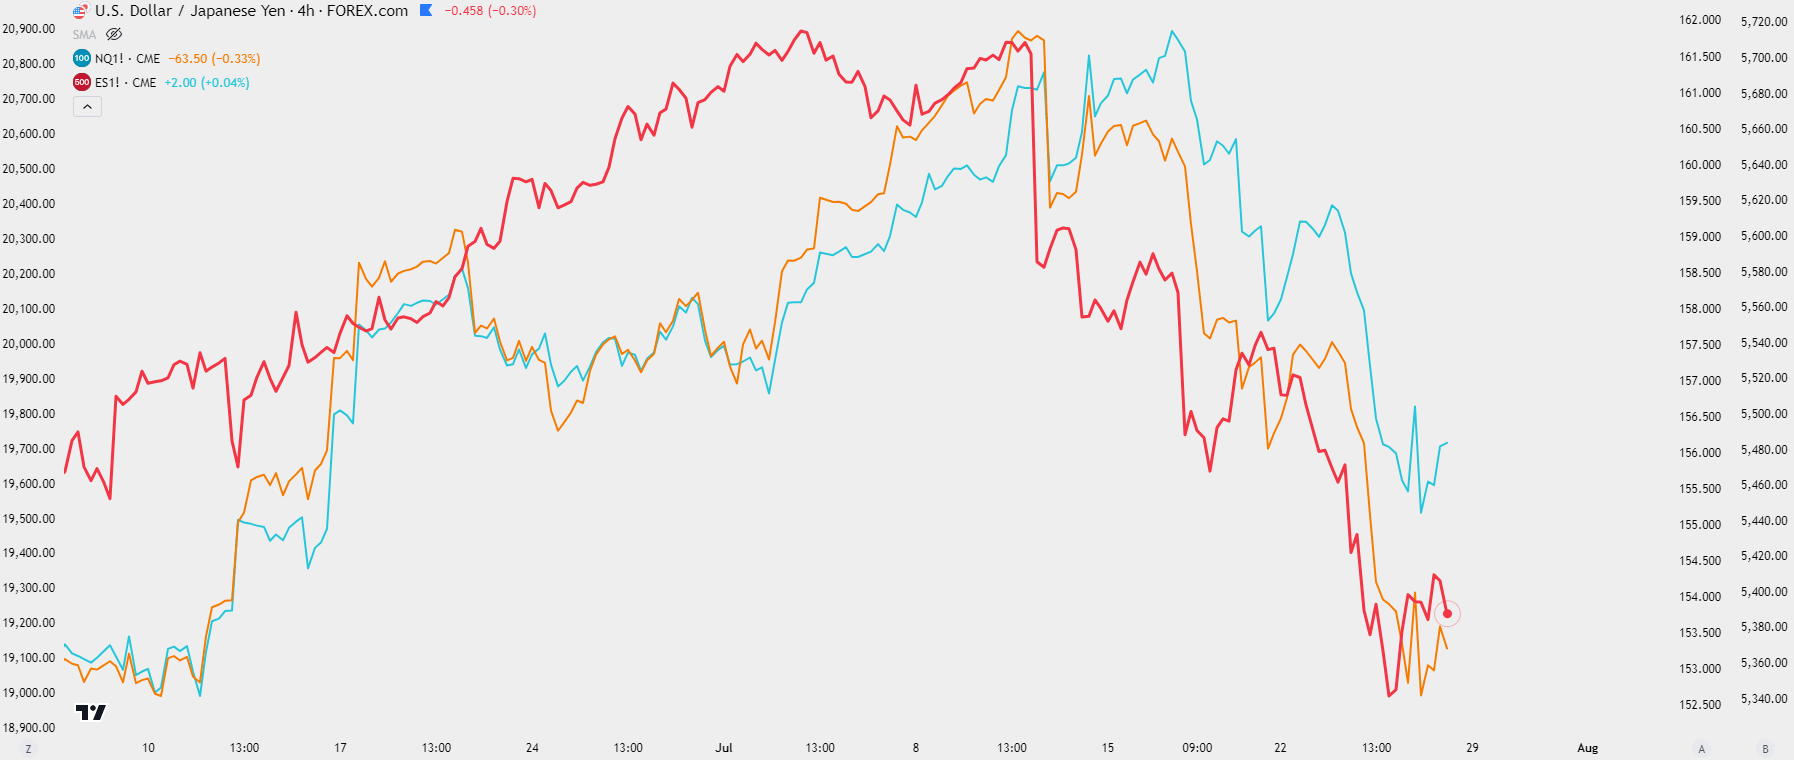 Chart prepared by James Stanley; data derived from Tradingview
USD/JPY Carry Unwind
First things first, I want to disclaim that correlations can be dangerous as they often diverge. But – if that relationship is to hold, the USD/JPY backdrop would be an important market to watch.
As of right now, however, support has held at a familiar spot with 151.95 marking the low for this week. This is the same price that marked the low in early-May, after the BoJ’s first intervention of the year. It’s also the same level that held the highs in 2022 and 2023, the former of which was defended by another BoJ intervention.
So while bearish momentum has been strong there’s a major support level or zone that they haven’t yet been able to take out – and for this theme – next week remains key.
The carry remains tilted to the long side of the pair – with rollover on the short side of the pair as negative – and this means that there’s a built-in incentive for bulls to defend support. The more interesting scenario is if they don’t, as that would highlight further fear that big picture change is afoot.
The pullbacks seen in Q4 of 2022 and 2023 were both driven by US CPI prints coming in below-expectations, which led to a more dovish expectation around the FOMC. If Powell sounds aggressively dovish next week – there could be motive for USD/JPY bulls to abandon the trade, driven by risk or fear of larger principal losses.
For support, I’m considering this on a long-term basis from the 150 psychological level up to the 152 level that’s become increasingly important over the past couple of years.
USD/JPY Weekly Price Chart
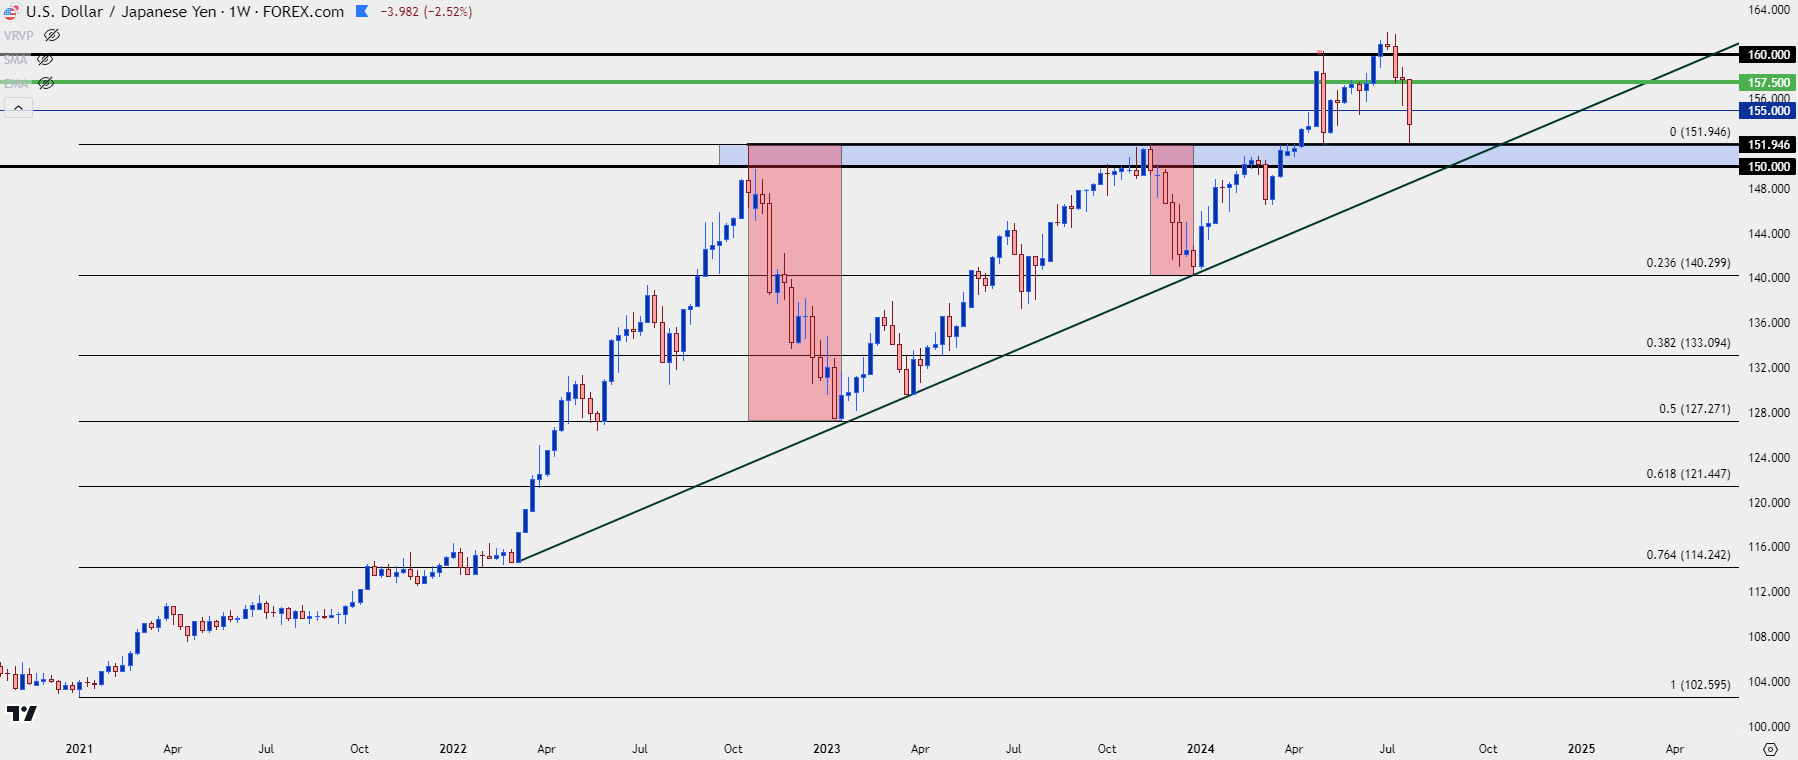 Chart prepared by James Stanley, USD/JPY on Tradingview
AI Bubble Fears
The sell-off following an earnings call centered around AI has already happened: We saw a similar outlay in Q2 after the META call. Mark Zuckerberg was asked how the company planned to recover the capital expenditure being driven in to AI and he didn’t seem to have a great answer. Quickly, fears of a Metaverse 2.0 populated. The stock gapped down by almost -15% the next morning.
But that fear didn’t last long as Microsoft reported a day later, and Satya Nadella appeared to be more prepared to answer that question. That helped to keep bears at bay and slowly, bulls returned to the matter and within a couple of months META was already bristling at fresh all-time-highs, which eventually hit in early-Q3 trade.
META reports on Wednesday after the FOMC but, as you can see from the chart below there was a similar, albeit more concentrated sell-off in the stock following the Google earnings call. This shows increasing discomfort behind the AI-theme and it’s revenue generating potential.
META Daily Price Chart
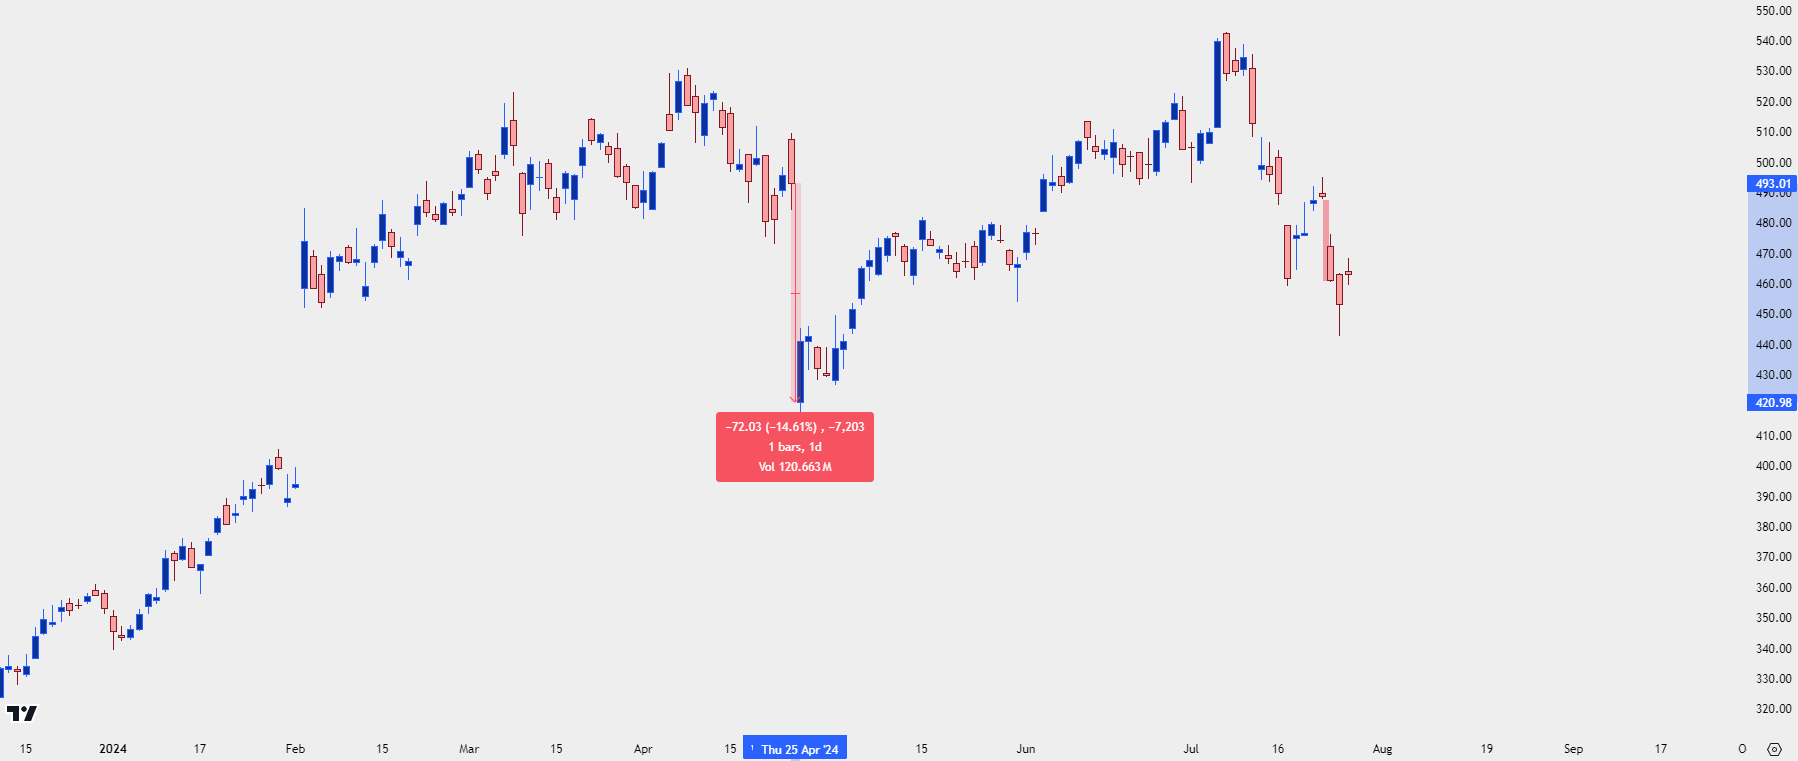 Chart prepared by James Stanley; data derived from Tradingview
For next week, it’s once again Microsoft in a position to save the day on the AI-theme as the company reports earnings on Tuesday, ahead of the FOMC rate decision.
MSFT has already tested at 10% pullback from the Q3 highs and support, so far, has shown at an aggressively-sloped bullish trendline taken from 2023 lows. The 400 level is an important point of defense for bulls in continued pullback scenarios, but I’m expecting Satya Nadella to go into that call with a number of hopeful items to discuss on the AI-front.
Microsoft Weekly Price Chart
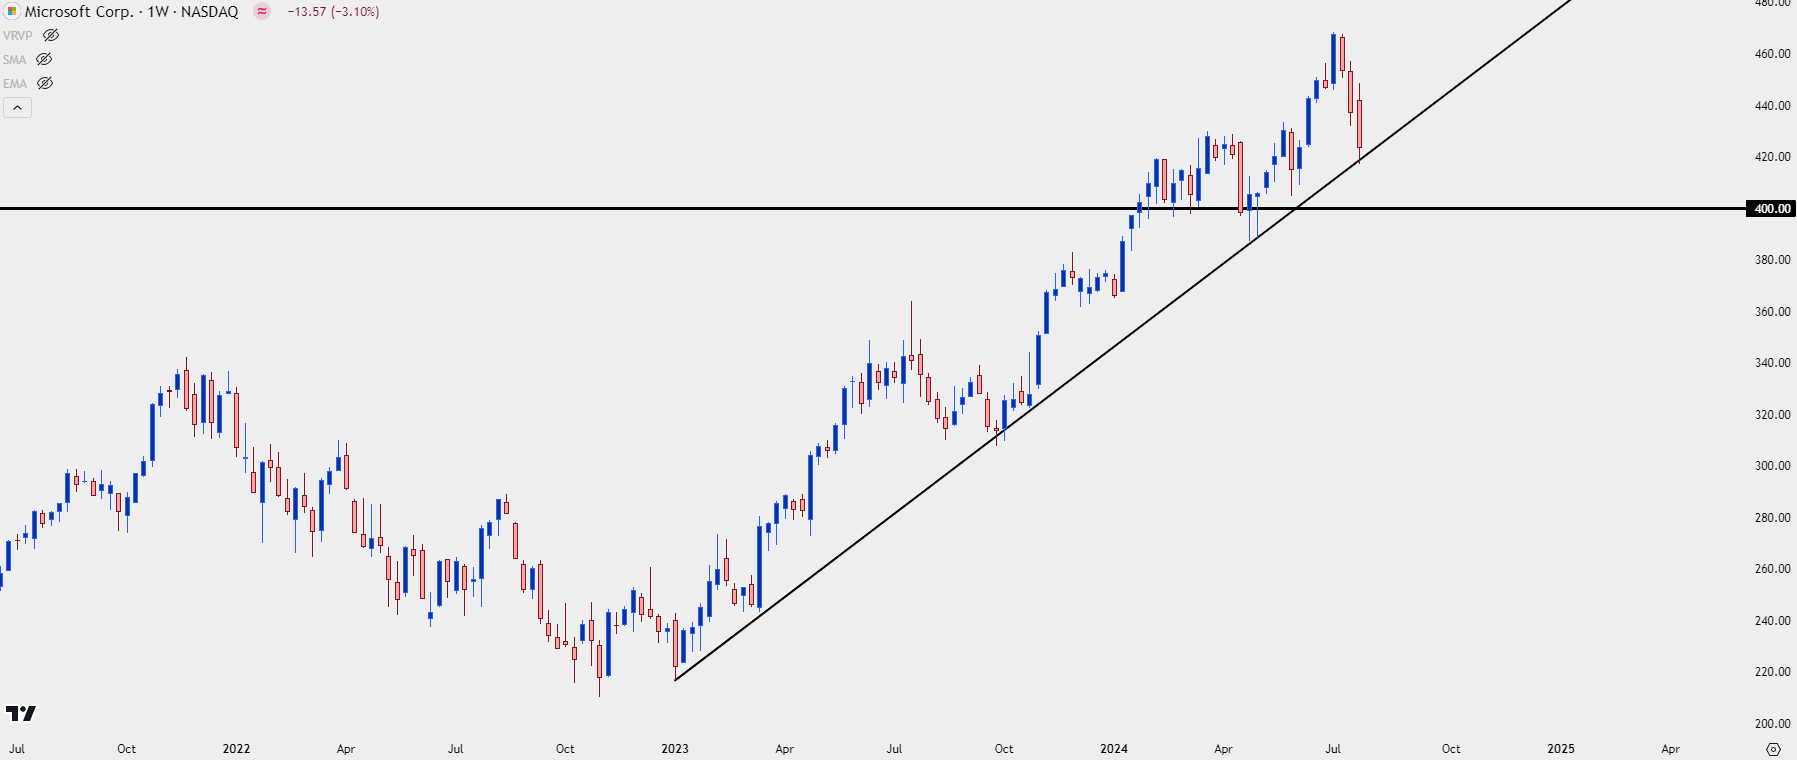 Chart prepared by James Stanley; data derived from Tradingview
The Indices
The Nasdaq was rocked as the tech sell-off gained steam this week, but even the S&P 500 was on its back foot. At this point the index has held a key spot of support, taken from the 127.2% extension of the Q2 pullback which is confluent with the support side of a rising wedge pattern.
Rising wedges are often approached with aim of bearish reversal and should bulls fail to drive in the next couple of weeks, particularly if the fundamental backdrop appears bullish with a dovish FOMC, bigger picture breakdown potential can become a more prominent theme.
S&P 500 Futures Weekly Price Chart
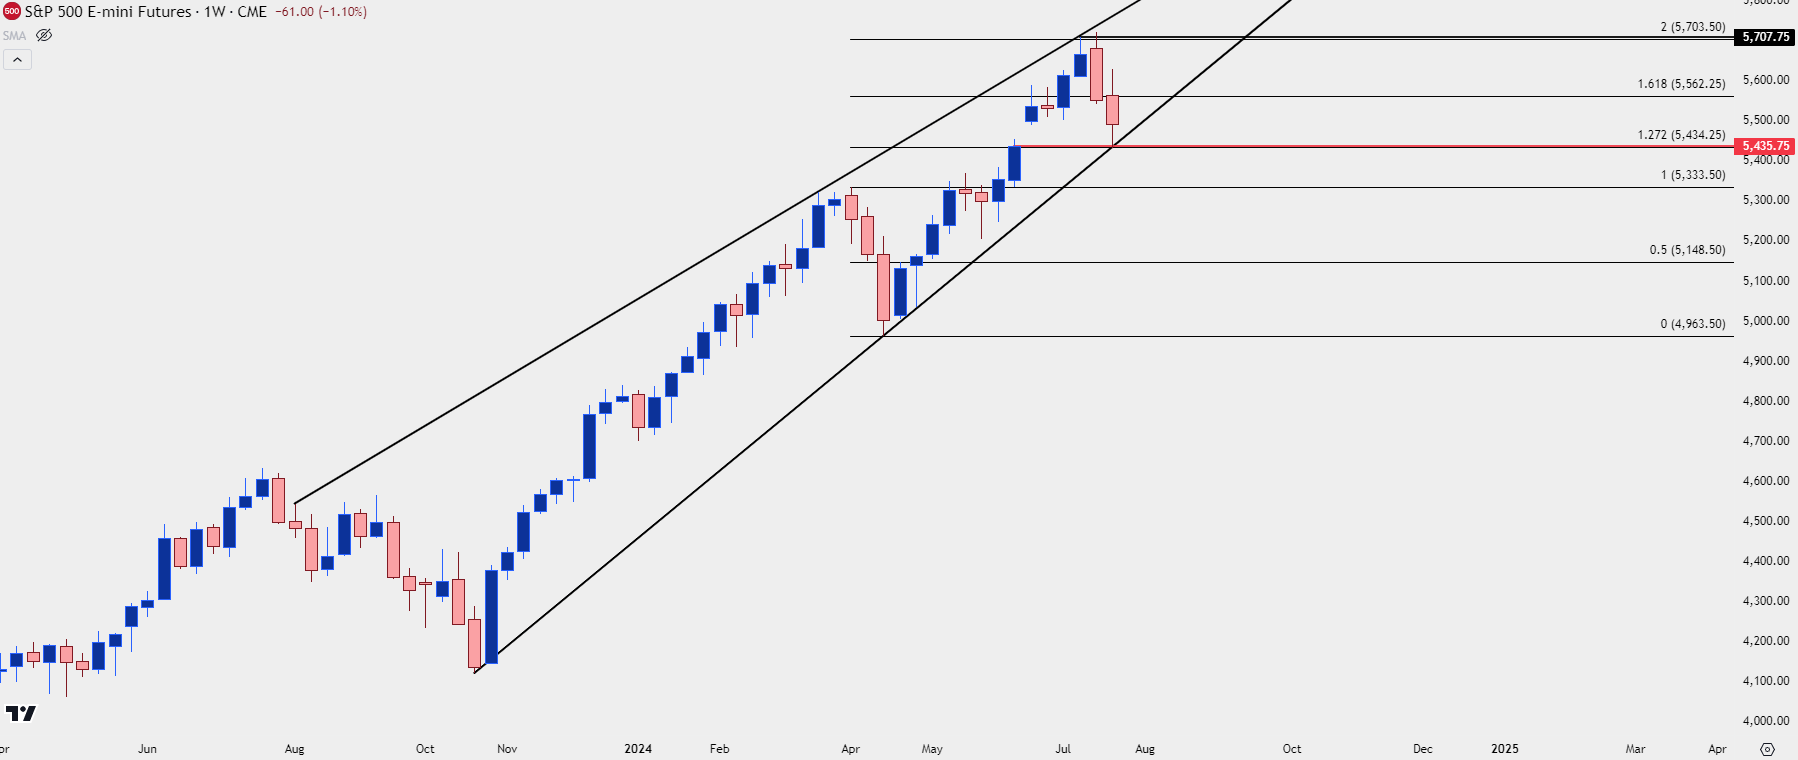 Chart prepared by James Stanley; data derived from Tradingview
The US Dollar
This report wouldn’t be complete without a look at the USD and, so far, the weekly bar is showing as a doji right at the 200-day moving average. This continues the longer-term range that’s been in-place for the past year-and-a-half but considering the sell-off in USD/JPY this week, with the Yen as a 13.6% component of the DXY quote, there could be reason for a bit more optimism than what the weekly chart below is showing.
If USD/JPY can hold that 151.95 level through next week’s trade, which includes a Bank of Japan rate decision along with that Fed meeting, there could be further scope for DXY gains.
While Powell may open the door to a September cut, it seems unlikely that he would commit to anything more as that would be unnecessary and given how aggressively-dovish rate cut hopes are already, it’s difficult for me to imagine a significant bearish bias in USD around that event.
But – the chart is showing indecision and that’s in the midst of longer-term price compression so, any indications need to be qualified with that as a very important and hefty grain of salt.
Given recent consolidation, it can be worth a look at the longer-term backdrop in DXY which I’ll do in the monthly chart below. There’s a long-term Fibonacci retracement plotted at 106.61 that’s been a roadblock for bulls and if we do see rectification in the near-term mean reversion, this becomes of interest for bigger-picture scenarios.
US Dollar Monthly Price Chart
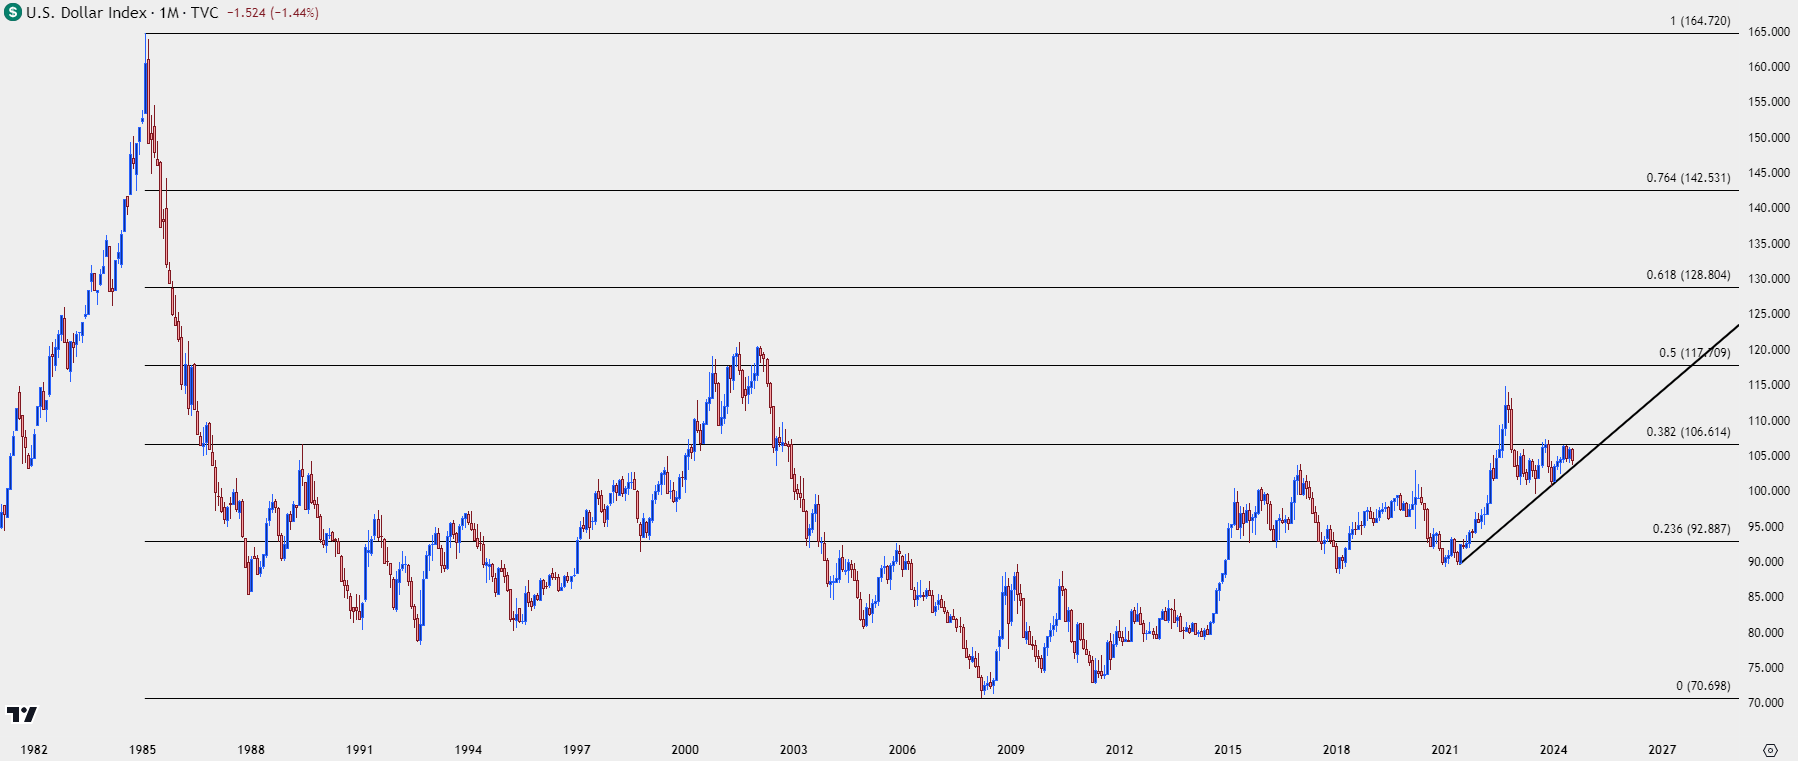 Chart prepared by James Stanley; data derived from Tradingview
From the weekly chart, we can get better view of that more recent consolidation theme along with the doji that’s currently showing right at the 200-day moving average. If bulls can budge above that indicator, it becomes an important point of defense for continuation scenarios.
Above that, the 105 level remains important as the 38.2% retracement of the 2021-2022 major move.
US Dollar Weekly Price Chart
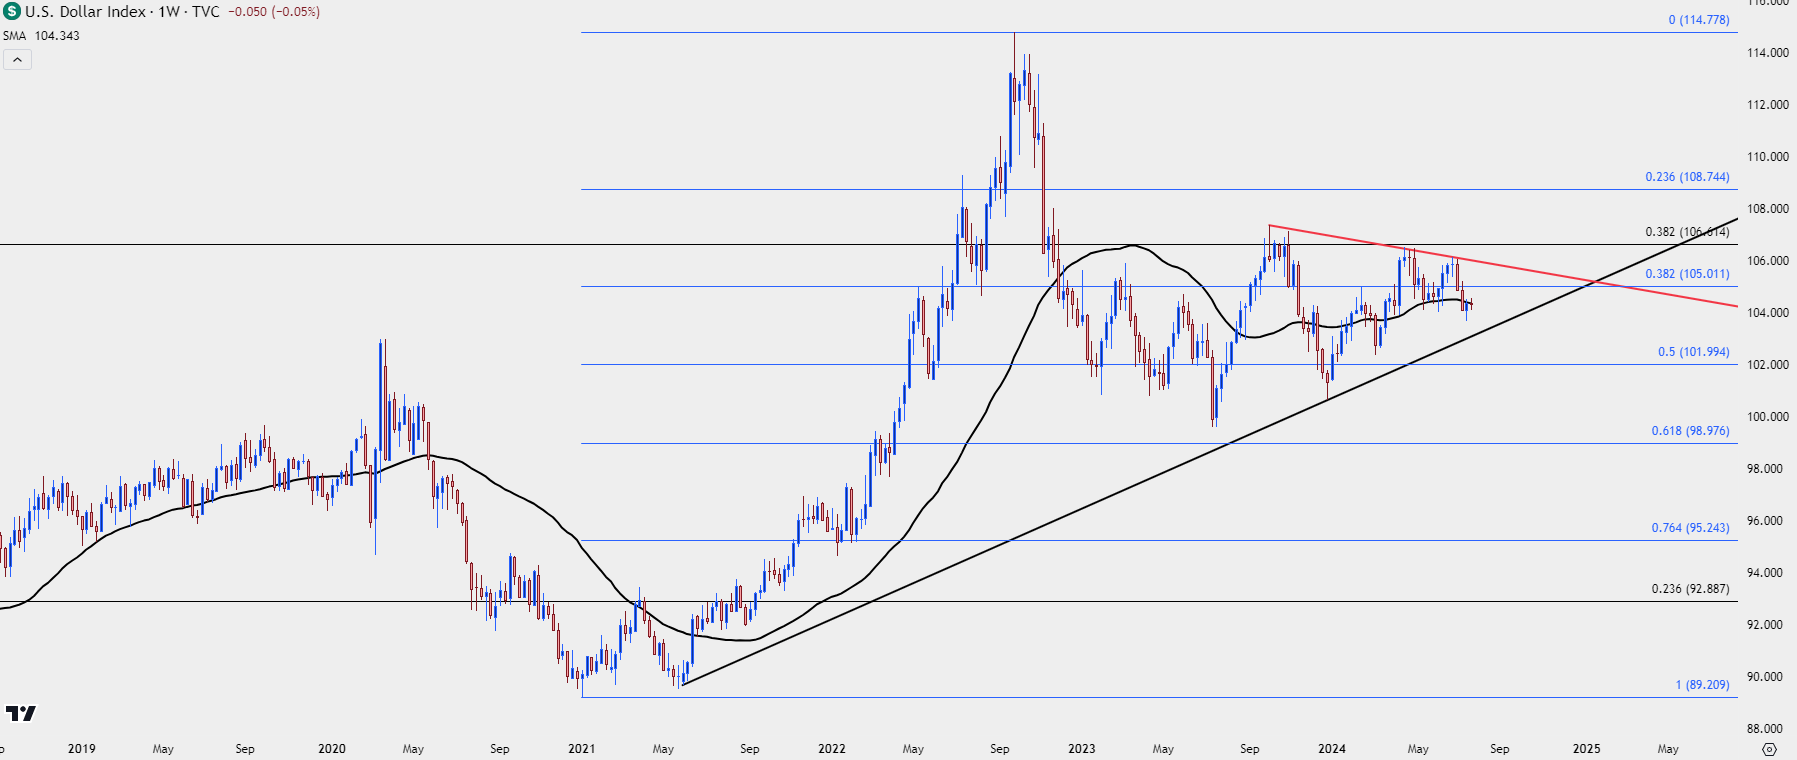 Chart prepared by James Stanley; data derived from Tradingview
--- written by James Stanley, Senior Strategist


