
Stocks, USD Talking Points:
- Today marks the start of this year’s Jackson Hole Economic Symposium.
- Tomorrow is the big day as there are speeches scheduled from FOMC Chair Jerome Powell and ECB President Christine Lagarde as highlights. Thickening the drama was the NVDA earnings report from yesterday that led to a strong push overnight in US equities, but that quickly dissipated after the open today.
- I’ll be discussing these themes in-depth in the weekly webinar on Tuesday at 1PM ET. It’s free for all to register: Click here to register.
It was pretty much the perfect setup for bulls when Nvidia reported earnings yesterday after market close. Nvidia, of course, has become the darling of US equity markets as the company’s chip manufacturing process has been a big driver behind the Artificial Intelligence boom.
Into yesterday’s close, before the earnings report, the stock was up a whopping 235% already on the year, taken from the lows in early January when the equity trade below the $150 level. It closed yesterday at 471.16; and that return is even larger if we draw back to the low last October. At the time NVDA was trading below the 110 handle to account for a whopping 336% return into yesterday’s close.
The excitement is obvious ad is well illustrated in that trend, and in yesterday’s earnings report they pretty much confirmed the growth that’s had markets so incredibly excited of late. Nasdaq futures made a strong leap after the US equity market close and when NVDA opened today, it tested above the 500 handle for the first time ever. But there was little demand over 500, or even at 490. The stock quickly dropped down to find support at its prior all-time-high, but this is probably not the response that equity bulls were looking for as we start the Jackson Hole Symposium.
The weekly chart below highlights this theme, and of relevance is the 161.8% Fibonacci extension that sits just inside of that 500 level. From the daily chart, there’s remaining unfilled gap down to 471.16 and then another gap from this week’s open that runs down to 433 to 442.22. Each of these are potential spots of support.
Nvidia - NVDA Weekly Price Chart (indicative only, not available on Forex.com platforms)
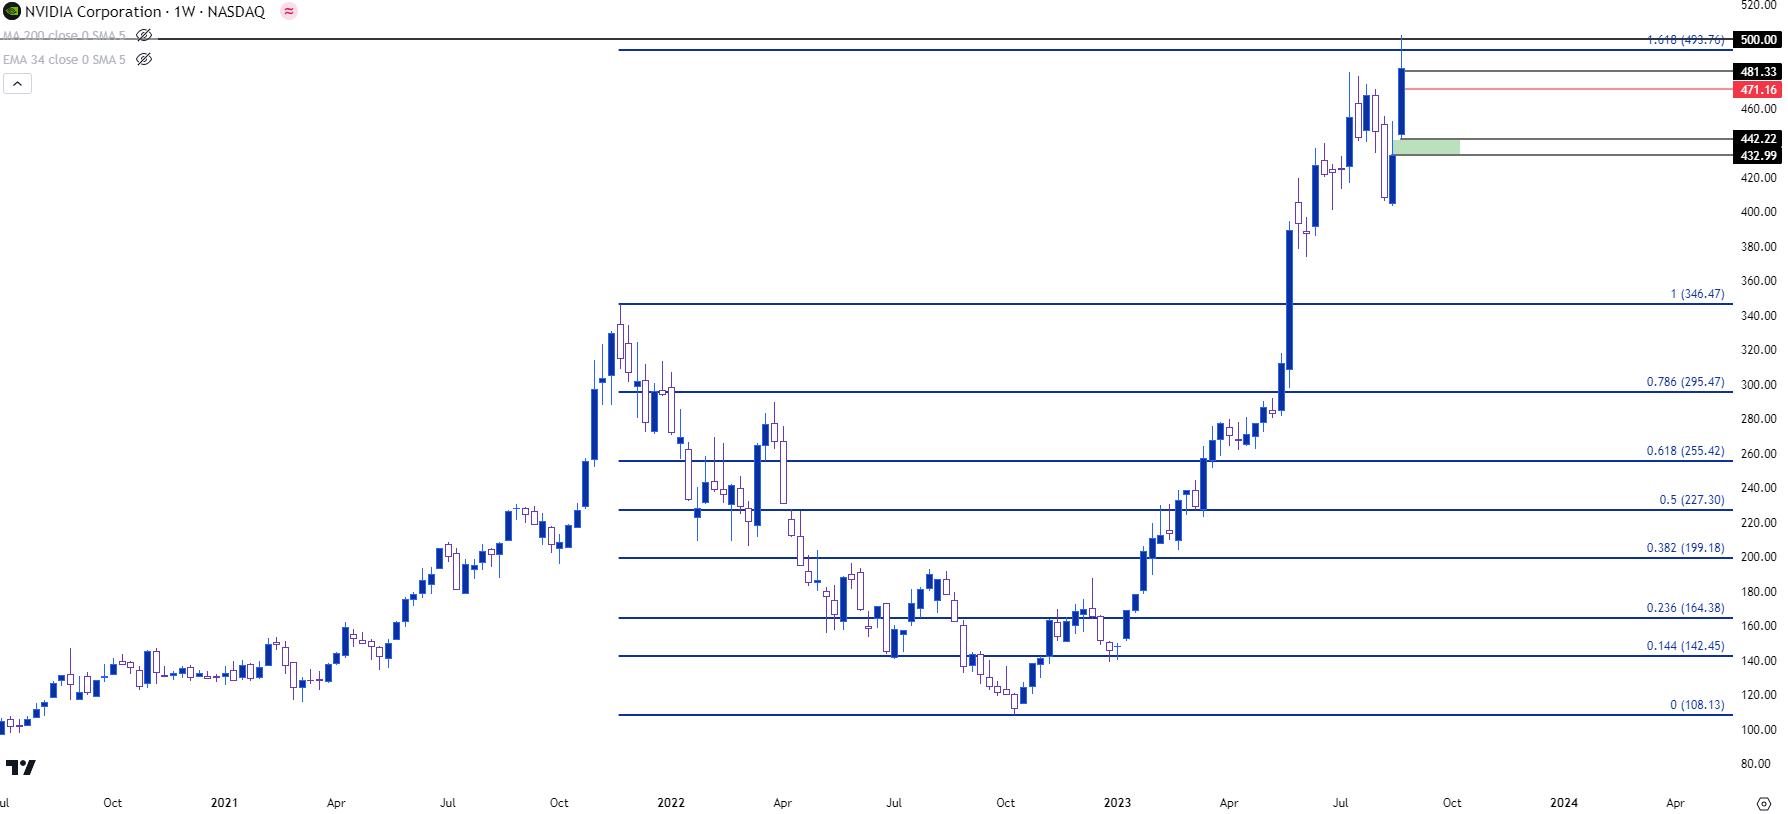
Chart prepared by James Stanley; data derived from Tradingview
Nasdaq
While NVDA has been at the forefront of the bullish drive, Nasdaq futures haven’t been as bullish as price still remains inside of the July high which remains below the prior all-time-high.
The excitement from that earnings report drove the index up to a key spot overnight, with resistance showing at the 15,423 level. This is the 78.6% Fibonacci retracement of the 2021-2022 pullback move and it as also resistance on two separate occasions in June and then July. It then became support after the Nasdaq rejected 16k, so it remains a key spot on the chart for directional themes.
There’s also a bit of confluence at resistance as taken from the bullish trendline connecting March and May swing lows. From the daily chart, we can see where price has erased the entirety of yesterdays ramp and, depending on how it closes, may finish off as a bearish engulfing pattern. Which, if it happens, would be a loud statement from bears rebuking the bullish run that built after that NVDA earnings report yesterday.
Nasdaq 100 – NQ Daily Price Chart (indicative only, not available on Forex.com platforms)
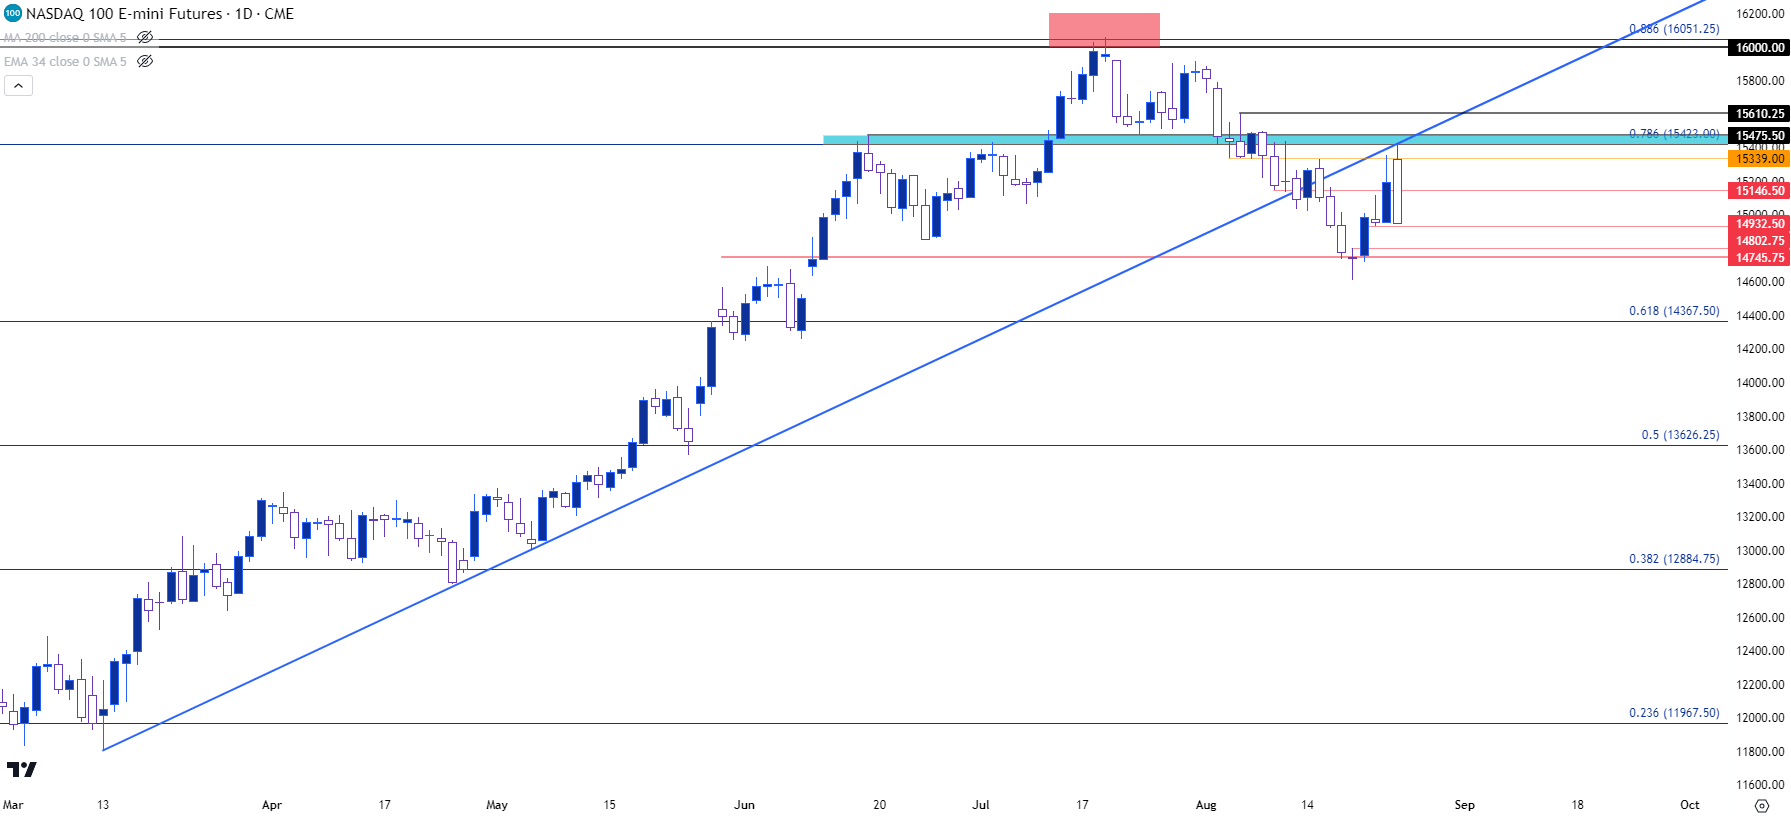
Chart prepared by James Stanley; data derived from Tradingview
Focus Shifts to Powell
At last year’s Jackson Hole Economic Symposium, Powell made a loud statement by warning markets that the Fed wasn’t yet finished with their inflation fight.
Ahead of that appearance stocks had ramped after setting a low in June, right when the Fed ramped up to 75 bp hikes, and that rally lasted for much of the next two months – even though inflation was only continuing to go up. So when Powell took the lectern on August 26th of last year he used the opportunity to warn markets that more hikes were on the way. In short order stocks had tipped over and continued selling off for much of the next six weeks before finally setting a low on October 13th, the morning of a CPI release.
What happened after that CPI release on October 13th is very similar to what happened in the lead-in to Jackson Hole – stocks ramped, driven by the hope that the Fed may be getting closer to the end of their hiking cycle. That theme ran its course until February of this year, when strong US econ data began to drive the expectation that even more hikes would be on the way.
Ironically, it was the tectonic shake in US banking in March that saved the day for equity bulls. As US banks started to get hit there was a growing chorus of calls for rate cuts, even with inflation remaining so far above the Fed’s target. The thought being that the Fed wouldn’t dare to risk more harm to the banking sector when much of what ailed the industry was poor interest rate risk management.
That helped to bring another bullish leg to equities – with the familiar theme of ‘bad news being good’ for stocks, and that’s continued to run into the summer, even as the Fed has hiked twice more since the banking issues cropped up in March.
The challenge that’s cropped up of late is just how strong the US economy remains to be, even after all the hikes the Fed pushed in last year. At this point GDP estimates for Q3 are nearing 6%, which would suggest that the Fed has much more work to do as core CPI is still above 4% by many measures.
And as this good economic data has shown in the US, illustrated again last night with Nvidia’s blowout earnings report, more and more questions are popping up around Fed policy and how many more hikes the bank will need to push.
We can see this relationship probably most clearly in Treasury Yields, as the 30 year bond set a fresh 12 year high for yield earlier this week.
US Treasury Yields – 30 Year (indicative only, not available on Forex.com platforms)
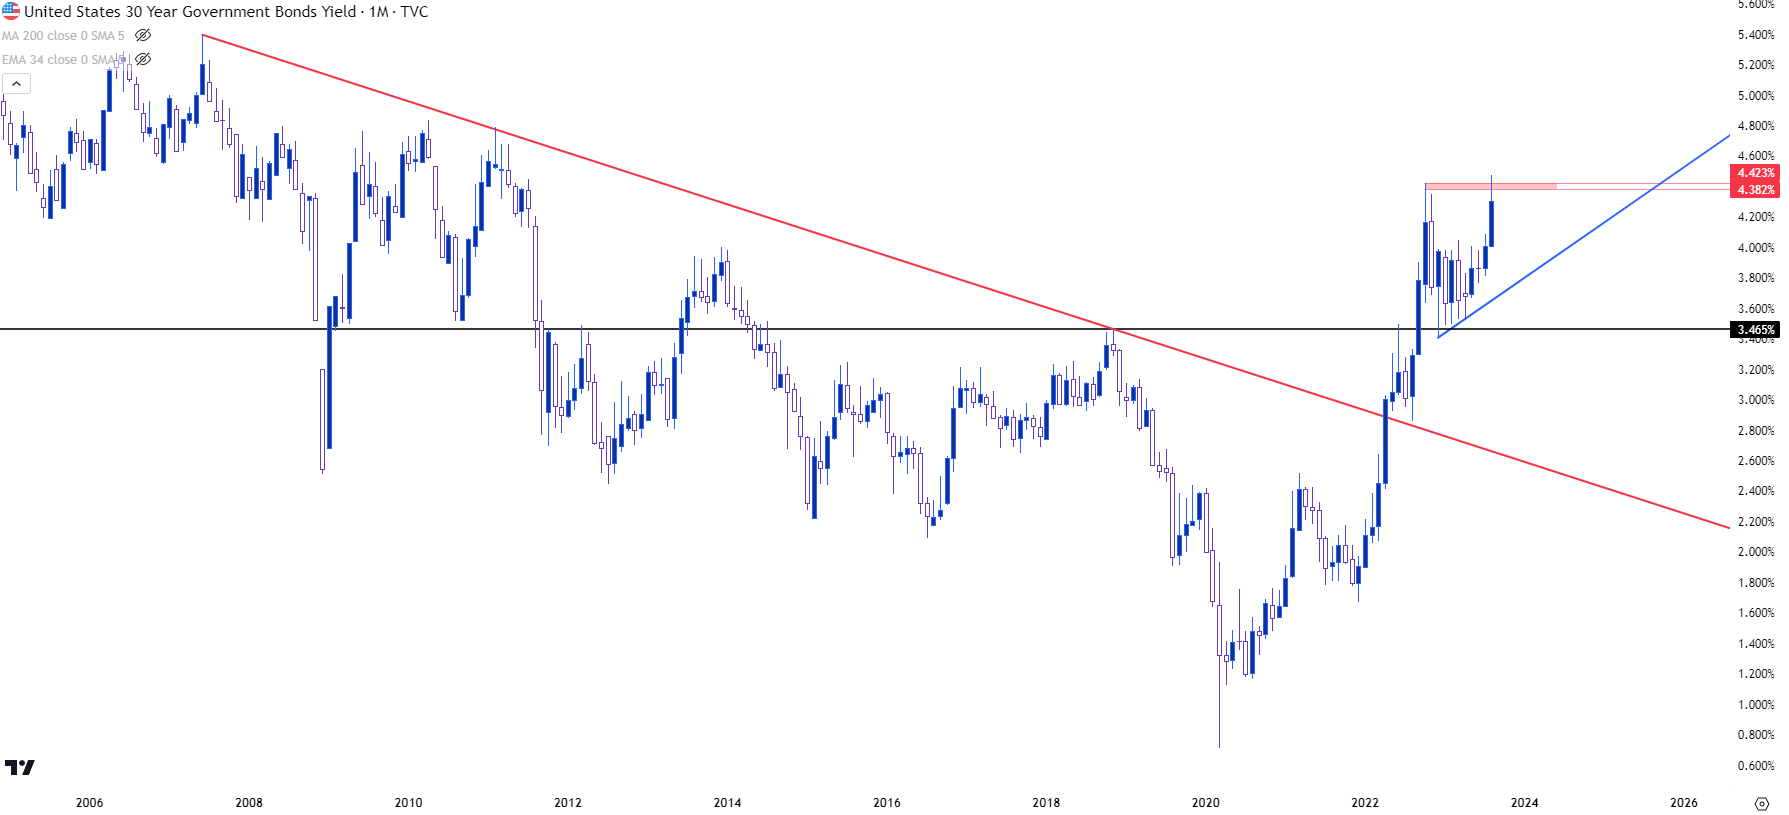
Chart prepared by James Stanley; data derived from Tradingview
For shorter-terms, the 10 year set a fresh 15 year high earlier this week when it crossed above the 4.34% marker.
US Treasury Yields – 10 Year (indicative only, not available on Forex.com platforms) 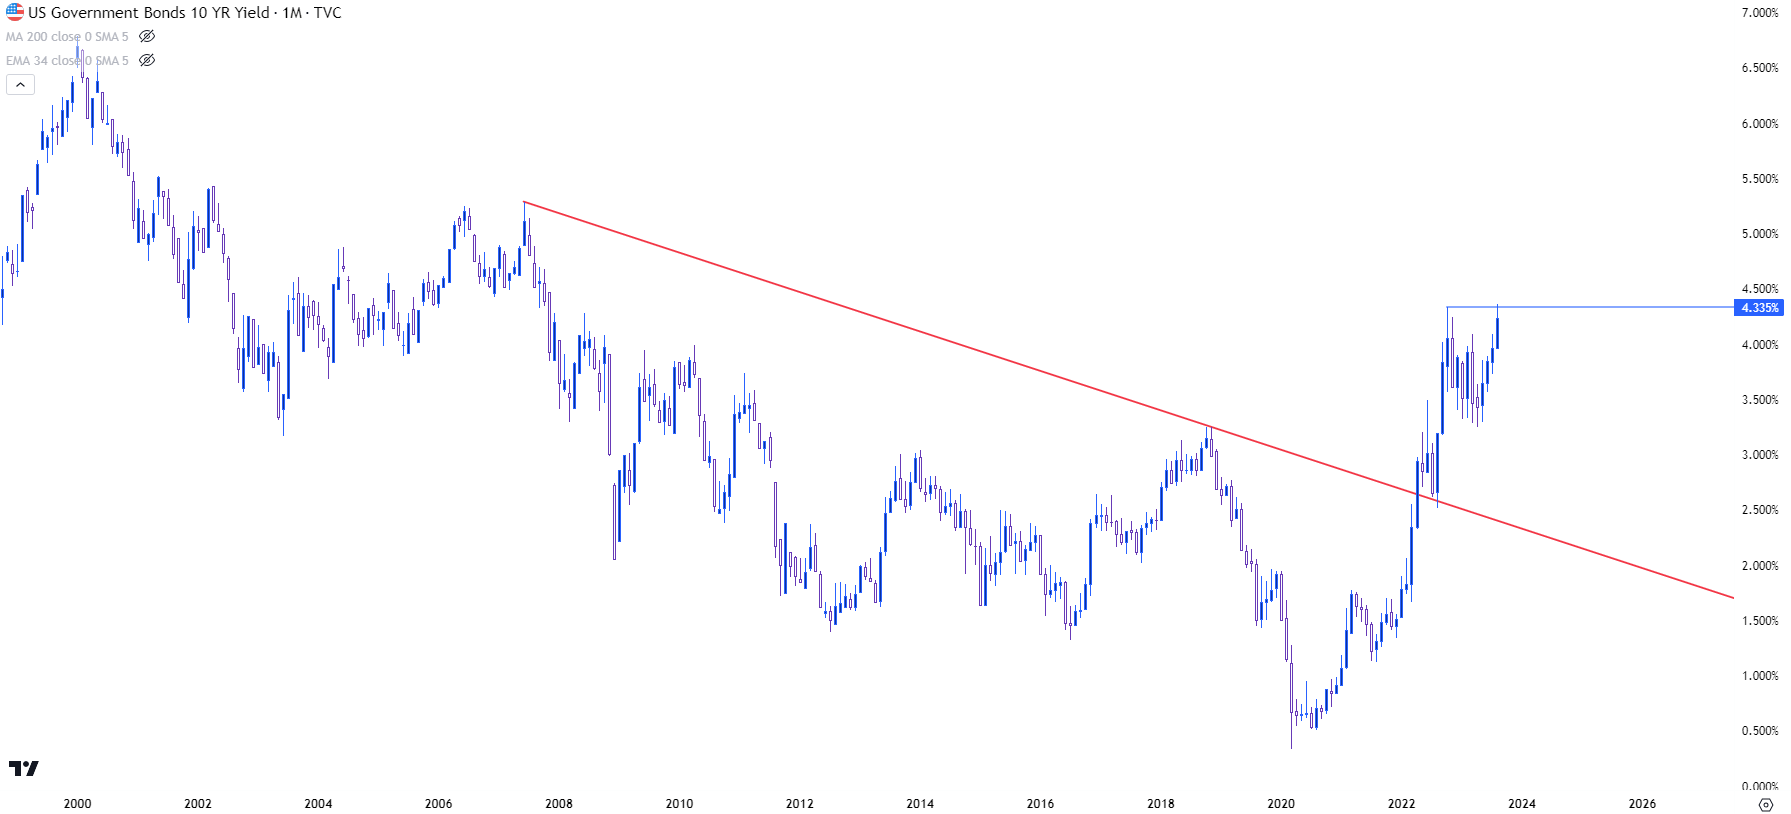
Chart prepared by James Stanley; data derived from Tradingview
The US Dollar
As this theme has developed over the past month there’s been another worry entering the equation, and that’s Europe. While US economic data remains hot on some fronts, helping to produce that GDP estimate that’s approaching 6%, there are far more questions around European economic data, as well as China, and these both produce some risk for US growth.
But, perhaps more to the point in the FOREX market, it produces questions around trends in both the USD and the Euro.
The Euro caught a major shot-in-the-arm last year when the ECB finally started hiking interest rates in the late summer. The first hike was in July, but the bank ramped up to 75 bp hikes in September and that ultimately is what helped to set a low in the pair.
But, as we came into 2023 trade those risks were a bit more balanced, and the first half of the year saw the EUR/USD pair remain in an abnormal amount of consolidation. A breakout attempted to show in July, just after a below-expectation CPI report out of the US. But EUR/USD caught resistance at a key Fibonacci level just a couple of days after that release and, since then, bears have had control.
Price has already slipped below the bullish trendline that guided the move higher off of the September lows, and today brings another push from bears as prices are testing below the 1.0845 level.
EUR/USD Daily Price Chart
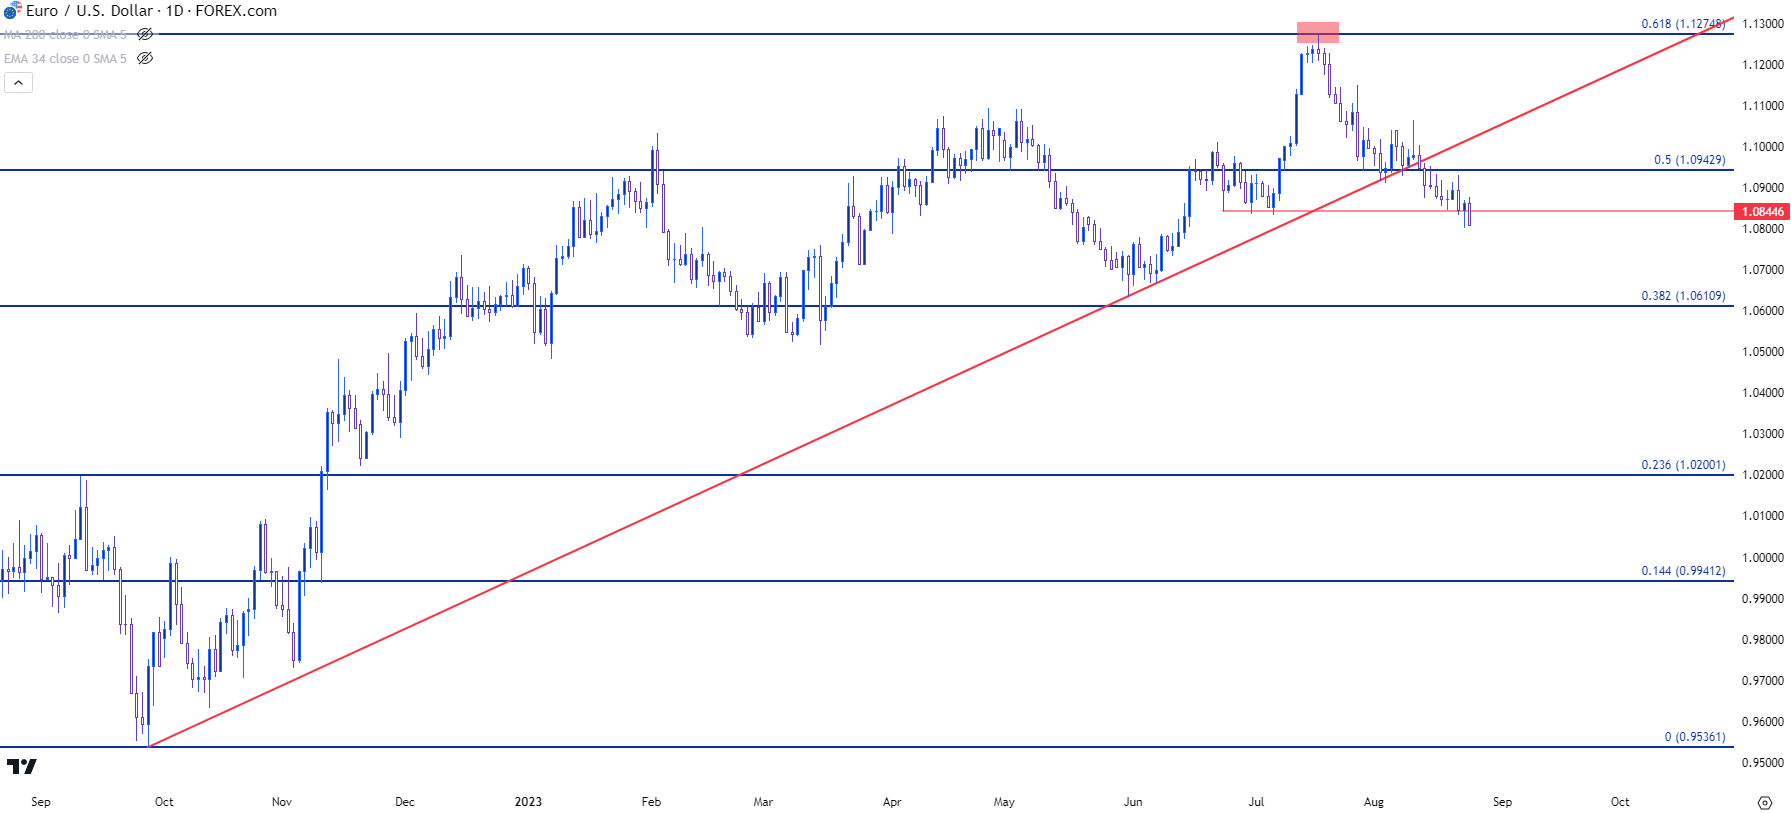
Chart prepared by James Stanley, EUR/USD on Tradingview
On the other side of the pair, the US Dollar continues to run and as of this writing is setting another fresh two-month high with a test above the 104 handle in DXY.
Perhaps most impressive in this recent bullish run has been the reaction from bulls in the face of seemingly bearish drive. Yesterday’s daily bar in the US Dollar was a bearish pin bar, which opened the door for reversals after the earlier release of PMI data. But with price now testing above that high, the formation has been invalidated.
But even drawing back to last week, when price was working on the breakout of the trendline (in red below) there was an open door for pullback – but bulls held support above 103. And the week before that when DXY was trying to break out of the falling wedge, or the week before that when CPI data came out below-expectations. This was ample opportunity for USD bears to run but instead – they were caught at support of 101.80 before bulls came rushing back in to force that falling wedge breakout.
This would indicate that bulls are supporting the bid and using pullbacks as an opportunity to add or open exposure. This is the type of feature that building bullish trends will often show as market sentiment waits for opportunity, and that opportunity can quickly become another higher-low.
US Dollar - DXY Daily Price Chart (indicative only, not available on Forex.com platforms)
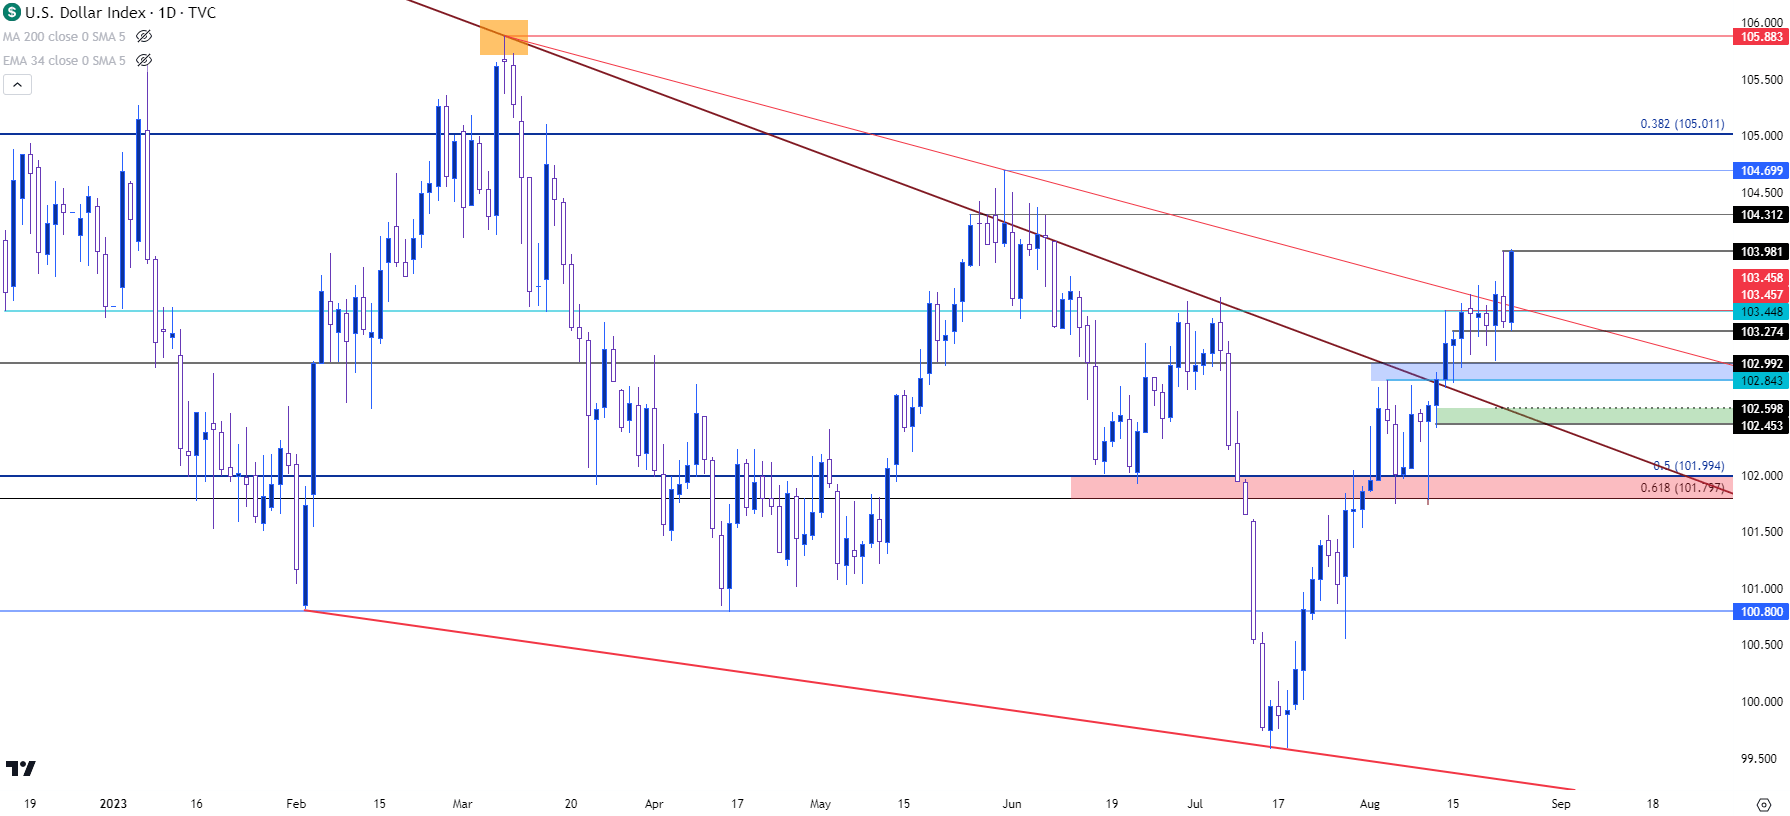
Chart prepared by James Stanley; data derived from Tradingview
Jackson Hole: What to Expect
This part is mostly going to be my opinion because it’s projection, but as I shared on the webinar on Tuesday, I’m not expecting Powell to be overly-telling in this speech. So, the Powell we saw at Jackson Hole last year may not show up and, instead, it may be more like the Powell that we saw at the July rate decision. This would entail more balance from the Central Bank head while also stressing data dependency, which markets will read as somewhat dovish since there’s no commitment there.
At the July rate hike Powell had said one of the benefits of not committing to any additional moves was the fact that the bank would get two more inflation reports and two more earnings reports before making that next rate move.
So, next week may be more important for USD trends as we’re getting PCE data and NFP on Friday of next week. For tomorrow, it would make little sense for Powell to cause damage if he doesn’t have to, and even if we look at last year, Powell making a commotion about rate policy isn’t necessarily going to produce the desired effect.
Last year, the Powell proclamation at Jackson Hole impacted equities for about six weeks: But that pivot on the morning of October 13th, even as CPI printed above expectations, was a clear illustration of market sentiment.
The question for now is – are we seeing another one of those? And the market’s reaction to Powell tomorrow, especially if he refrains from any pointed speech or projections, could be telling towards this end.
To close, I want to take a step back to the longer-term chart of the US Dollar and this is one of the items that suggests upside potential. The falling wedge took more than six months to build and so far in August we’ve seen a strong bullish push from buyers that’s already created the breakout.
US Dollar - DXY Weekly Price Chart (indicative only, not available on Forex.com platforms)
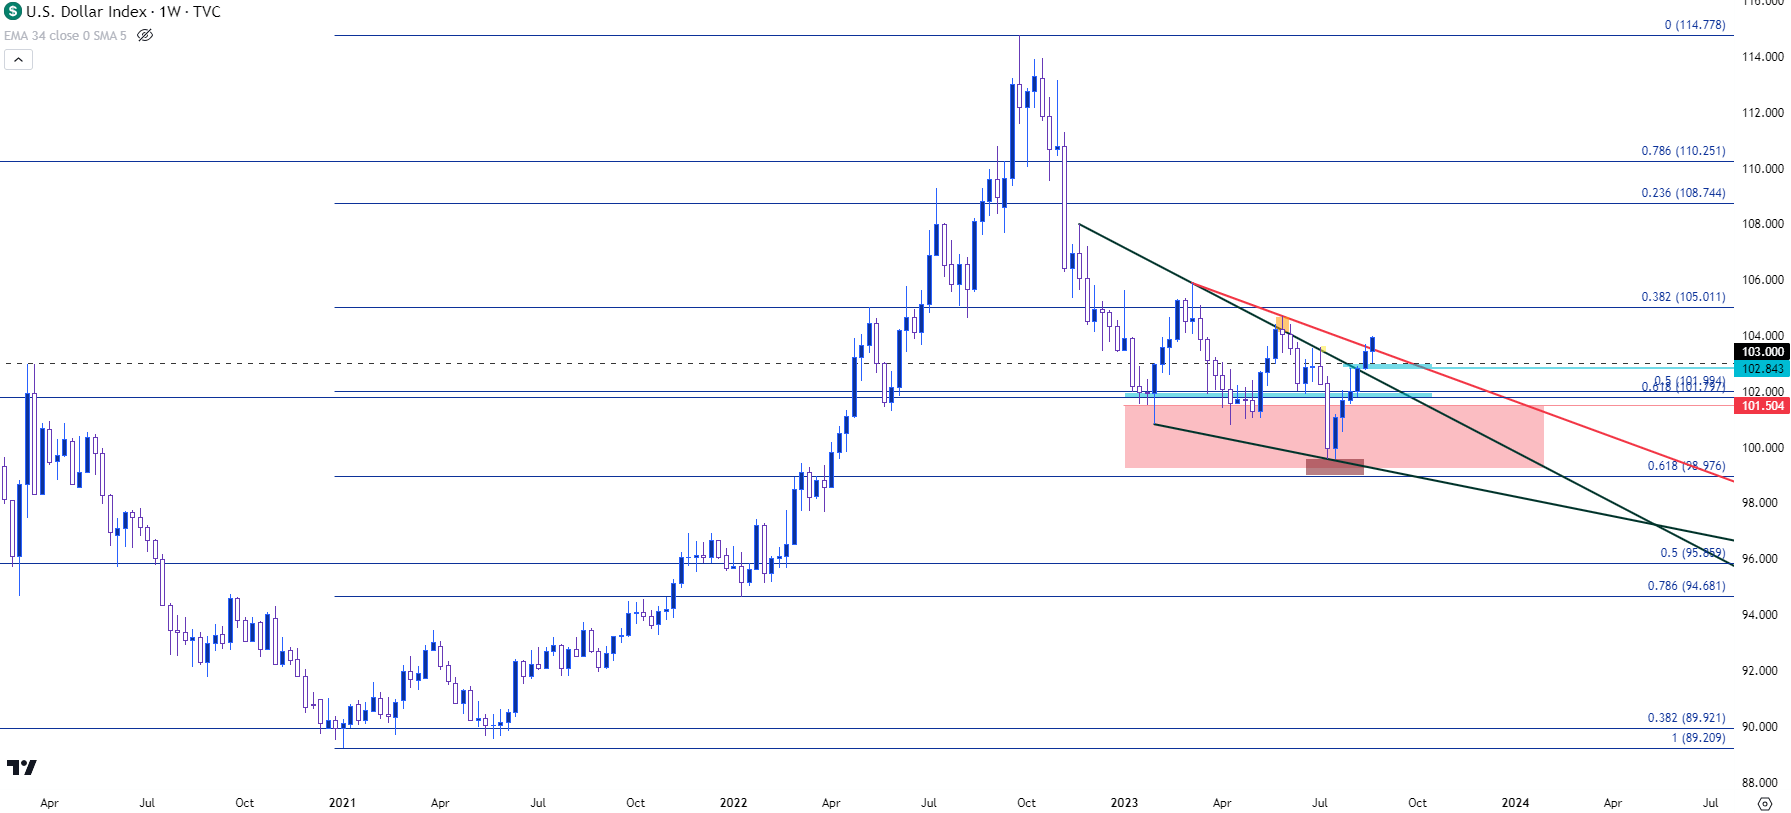
Chart prepared by James Stanley; data derived from Tradingview
--- written by James Stanley, Senior Strategist


