European stocks have been battered this morning, with banks taking the brunt of the sell-off. Sentiment continues to remain downbeat because of growing concerns about the global economy, which is not looking healthy at all at the moment with growth in China slowing down and the US struggling. In addition, oil prices have been unable to further extend their recent gains and are now down for the third consecutive session with WTI trading at $30 a barrel again. It looks like oil traders are once again discouraged by a slightly stronger dollar and the lack of any breakthrough in talks between some OPEC and non-OPEC producers. But it is also surprising that bullish traders have not shown much interest here despite growing signs that US oil production may soon fall sharply. Indeed, the oil rigs count fell by a further 31 rigs last week according to Baker Hughes. Not only was this the seventh consecutive weekly decline, it was the most pronounced since April 2015. At just 467 active rigs, drilling activity is now at its lowest level since March 2010 having dropped by about 70% since the start of 2015. But all it takes is a big trade to trigger buying momentum again and at $30 a barrel, WTI is undoubtedly looking attractive for some speculators, especially those who missed out on the bounce in mid-January. Conversely, others still expect to see another big drop before prices stage a rally. In any event, oil prices could be very close to a bottom and so they may rebound dramatically soon, which could only be good news for energy stocks. Added to this, the EUR/USD exchange rate had its first red day in five on Friday. If the euro now goes on to extend its decline, this could boost the appetite of some export names. There are also lots of European companies which will be reporting their quarterly results this week. Any positive surprises may give the markets a much-needed boost from these severely oversold levels.
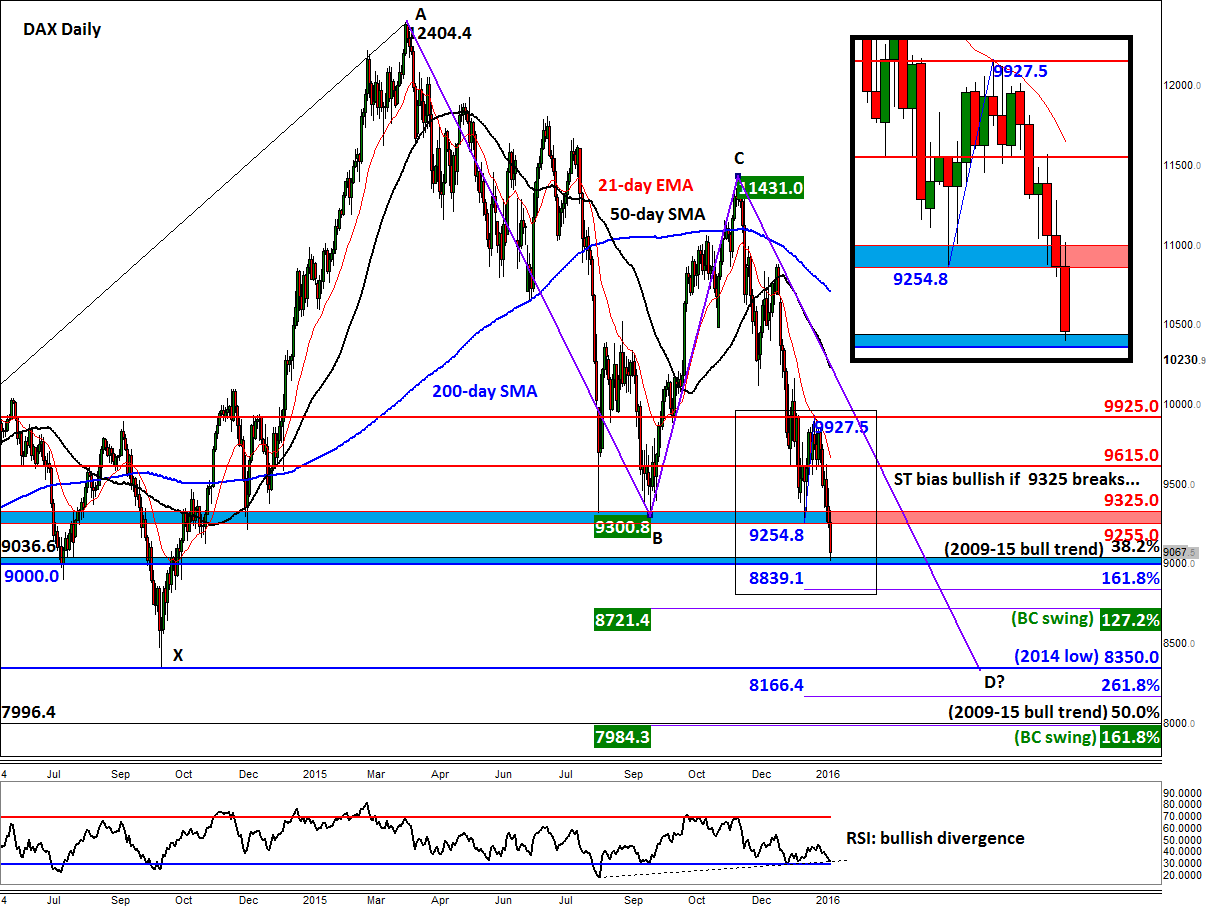
So, there is a possibility for a sharp rebound in stock markets. However, the technical outlook on some of the major indices, such as Germany’s DAX, is looking increasingly bearish following the breakdown of further support levels. On Friday, the DAX broke below a major support around 9300. This level had provided strong support on at least three occasions in the past, most notably at the end of September when it bounced a good 2130 points or almost 23 per cent from there before the rally eventually stalled at 11430 (point C on the chart) at the end of November. This 9300 level – or more precisely, the support range between 9255 and 9355 – offered support most recently on 20th January, leading to an eventual bounce to 9925. But this represented a much shallower pullback compared to the previous occasion, and it thus correctly pointed to growing selling pressure and a breakdown of this 9255-9355 range. Now that the index is below here, more losses could be on the way. However, if there is little further follow-through in the selling form here then it is possible that the index could regain its poise and climb back above the 9255-9355 range. This scenario would be deemed a bullish outcome, especially given the positive divergence on the RSI.
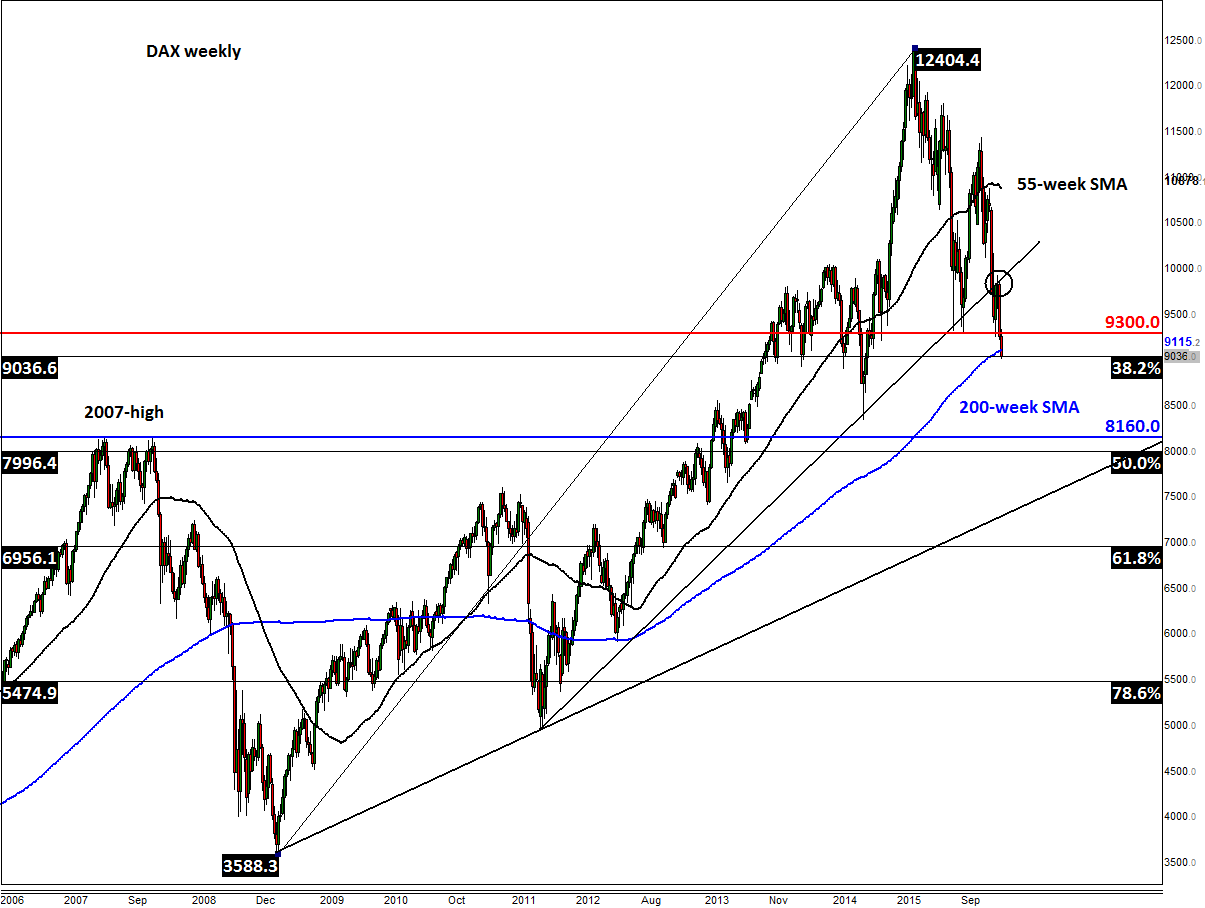
But for now, the sellers remain in control and the bear trend is getting stronger with each key level of support breaking down. At the time of this writing, the DAX was testing another important support around the 9000-9035 area. The lower end of this range is a psychologically-important level while the upper end marks the 38.2% Fibonacci retracement of the entire 2009-2015 upswing. It is possible the index may stage at least a short-term rally from here. Below 9000, there are a couple of shorter-term Fibonacci extension levels to watch at 8840 and 8720, as shown on the chart; then not much further reference points are seen until the 2014 low of 8350.
So, things could turn very ugly if the buyers do not show up soon. Even if they do, they will still need to chop a lot of wood to get us back above 9325 – at this stage only a closing break above this level is required to turn the short-term outlook back to bullish. But if this were to happen then a rally towards the previous resistances around 9615 or even 9925 would become likely.
Figure 1:

Figure 2:


