S&P 500 Talking Points:
- The big data point is here with this morning’s release of U.S. CPI.
- Just a week ago stocks were in poor shape, but a strong rally on Thursday helped by initial jobless claims data in the US got bulls back on the bid and the S&P 500 has accelerated higher ever since. Yesterday saw the index finish retracing the losses from the early-month NFP report.
- I’ll be looking into these setups in the Tuesday webinar and you’re welcome to join, click here for registration information.
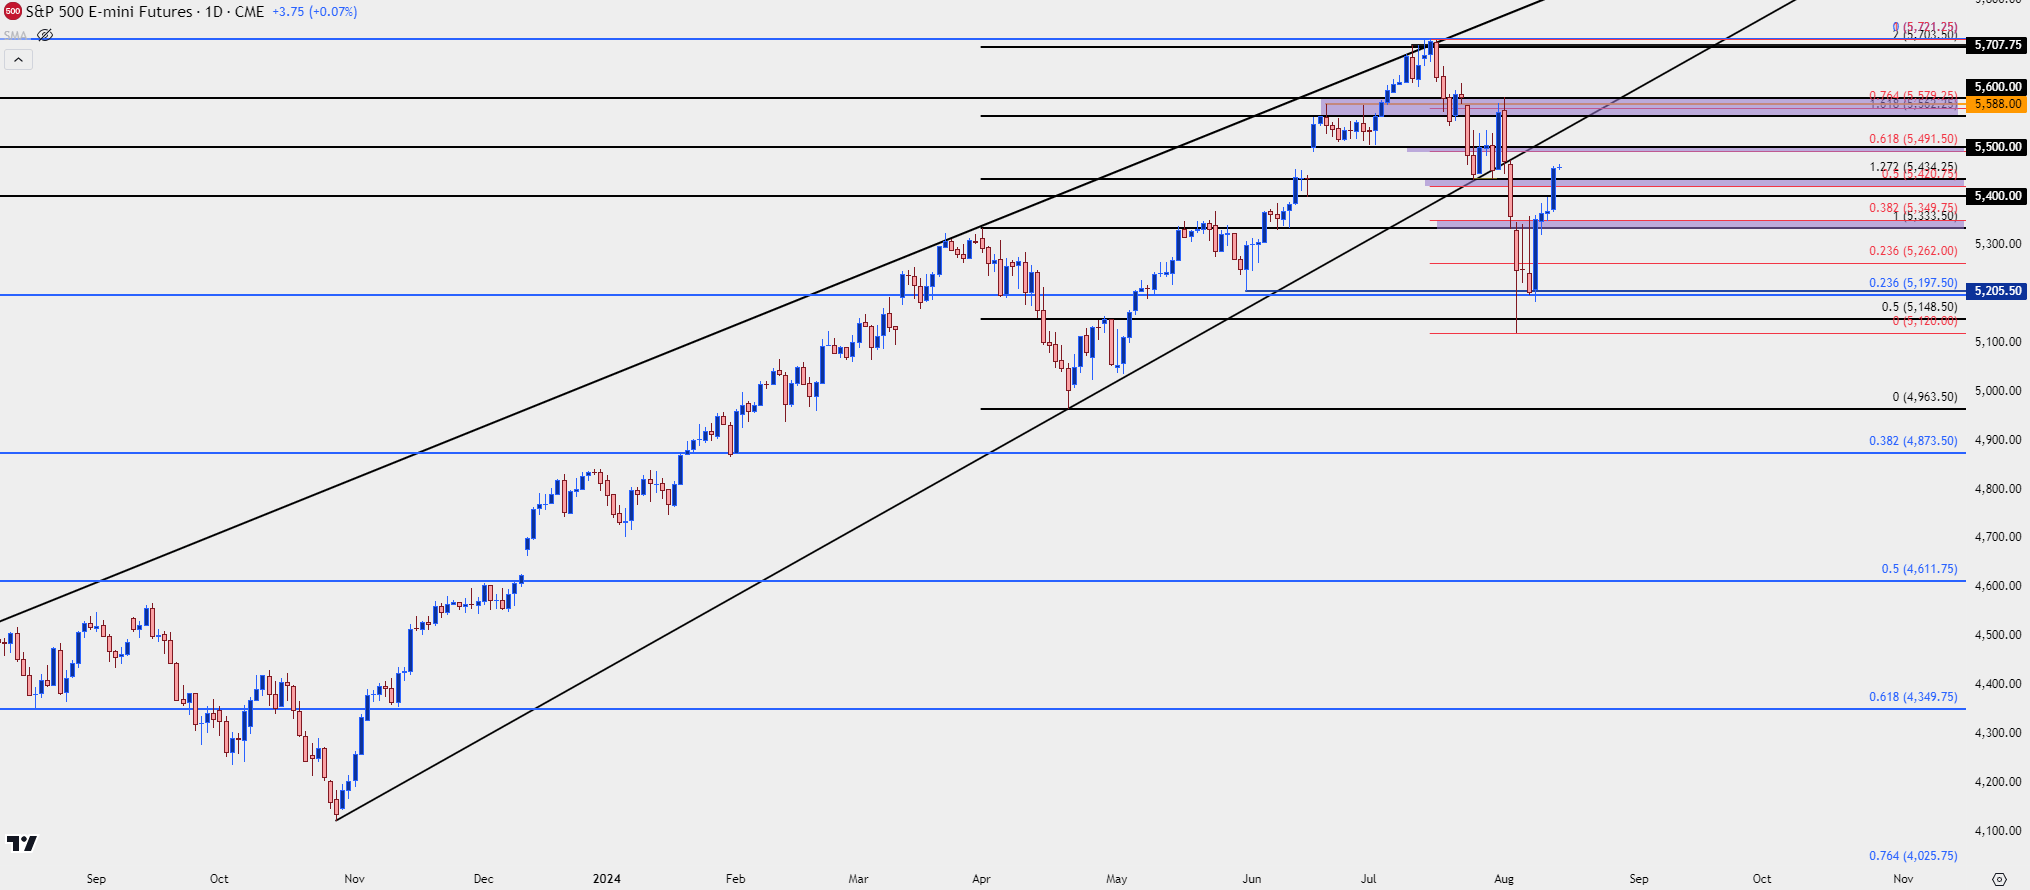
Last week’s hammer in the S&P 500 has so far seen bullish follow-through this week. A doji on Monday led to a strong breakout yesterday and at this point, the S&P 500 has recovered more than 50% of the sell-off that started in July and the entirety of the move that priced-in after the early-August NFP report.
Positive U.S. data has been a big driver of that with last week’s Services ISM on Monday helping to hold the lows, and then the Thursday initial jobless claims data kick-starting the rally. But we’re now about to face the big one with U.S. CPI for the month of July and this will likely need to be a ‘goldilocks’ print to keep the rally going. That’s what we saw with PPI yesterday as it printed slightly below the expected, so not too far lower to stoke fears of emergency rate cuts, which could lead to flows into bonds. And not too strong to back markets off of rate cut expectations.
From the daily chart below we can see the prior structure that led to the pullback. The S&P 500 fell through the bottom of a rising wedge pattern earlier in August, a formation often approached with aim of bearish reversal.
Higher-low support showed at 5200 and that price saw a lot of activity last week until the Thursday rally took-hold. The 61.8% retracement of the sell-off plots a little higher, and its confluent with the 5500 level which is a big spot for today. Above that, there’s levels at 5562.25, 5588 and 5579.25 to create another confluent zone.
For support, it was the 5400 level that price broke-through yesterday, leading to continued breakout. But there’s a nearby zone from 5420-5434.25 that remains of note, with 5400 below that, followed by 5333.50-5349.75.
If sellers can break through that third spot of support, that would be a notable move and it would open the door to deeper pullback potential.
S&P 500 Daily Price Chart
 Chart prepared by James Stanley; data derived from Tradingview
--- written by James Stanley, Senior Strategist


