S&P 500 Talking Points:
- Stocks came screaming back over the past two weeks, with a hammer formation on the weekly leading into a very strong bullish move last week.
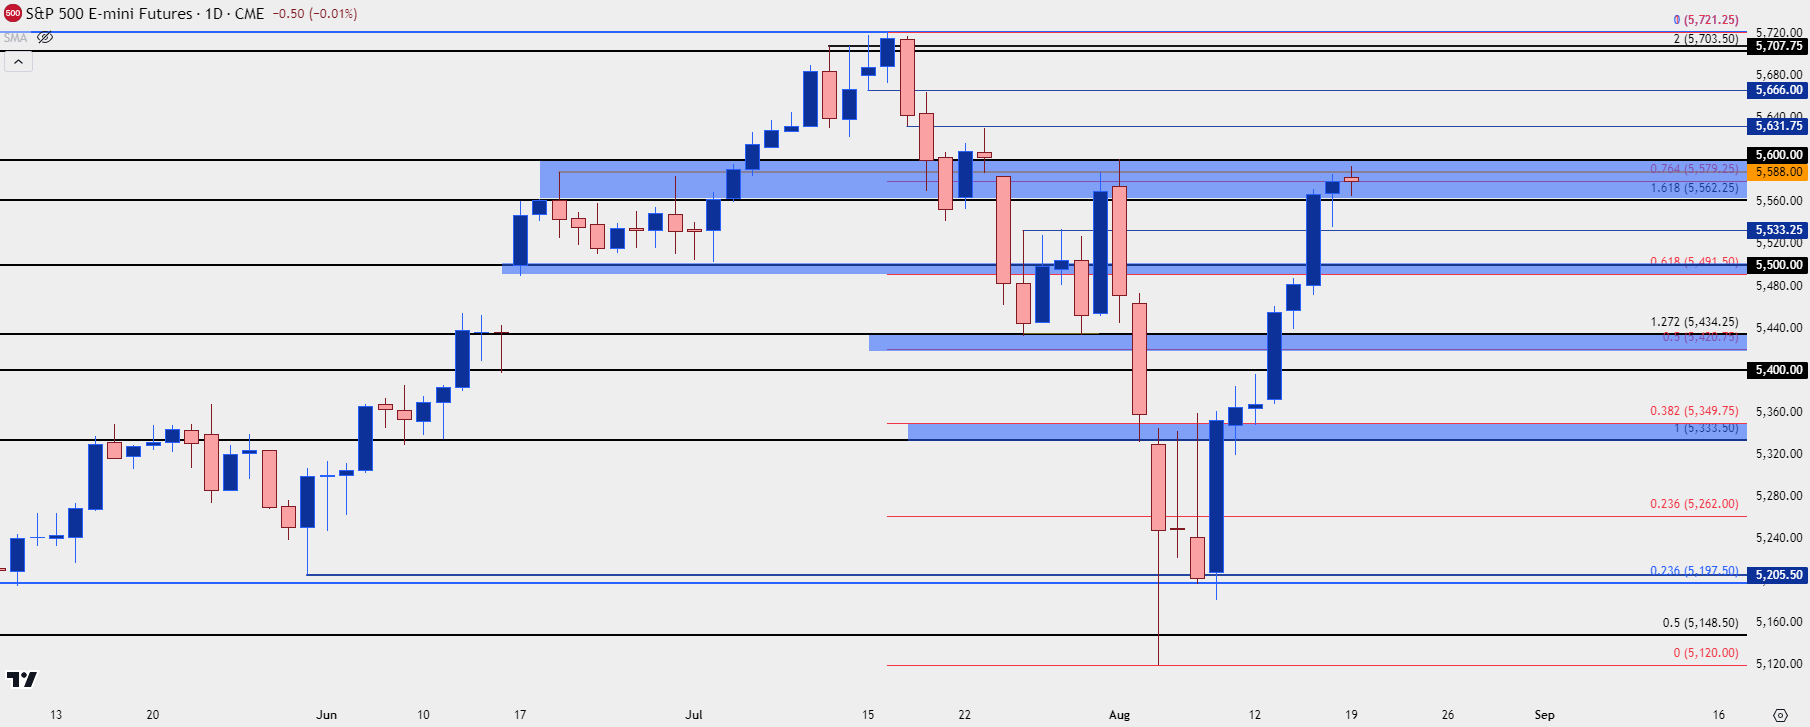
- S&P 500 Futures have moved up to the final resistance zone that I looked at on Thursday, spanning from 5562-5600. The big question now is continuation with price re-testing the same resistance that brought bears into the equation in July.
- I’ll be looking into these setups in the Tuesday webinar and you’re welcome to join, click here for registration information.
It was a strong week for stocks as positive U.S. data pared back expectations for a near-term U.S. recession. While the USD/JPY carry unwind was often cited as a primary cause of the July sell-off, the fact that the pair put in a sell-off on Friday (and so far, continuing today) even as stocks retained strength highlights the fact that there was something else going on. My contention has been the pricing-in of recession, with a fast move developing in U.S. Treasuries as market participants tried to get in-front of FOMC rate cuts.
The Treasury trade can be quite attractive in a rate cutting backdrop, particularly if those rate cuts are coming in at 50 bp increments as markets had started to expect.
The question now is whether bulls can continue the push with prices re-testing a key spot of resistance in S&P 500 Futures. The 5600 level was a point of contention back in June, holding the highs for a couple of weeks before bulls pushed for a break. That break didn’t last long, however, as the sell-off started to hit on July 11th, just after the Bank of Japan intervened following a below-expected US CPI report.
S&P 500 Futures Daily Chart: Back to Prior Resistance
 Chart prepared by James Stanley; data derived from Tradingview
S&P 500 Shorter-Term
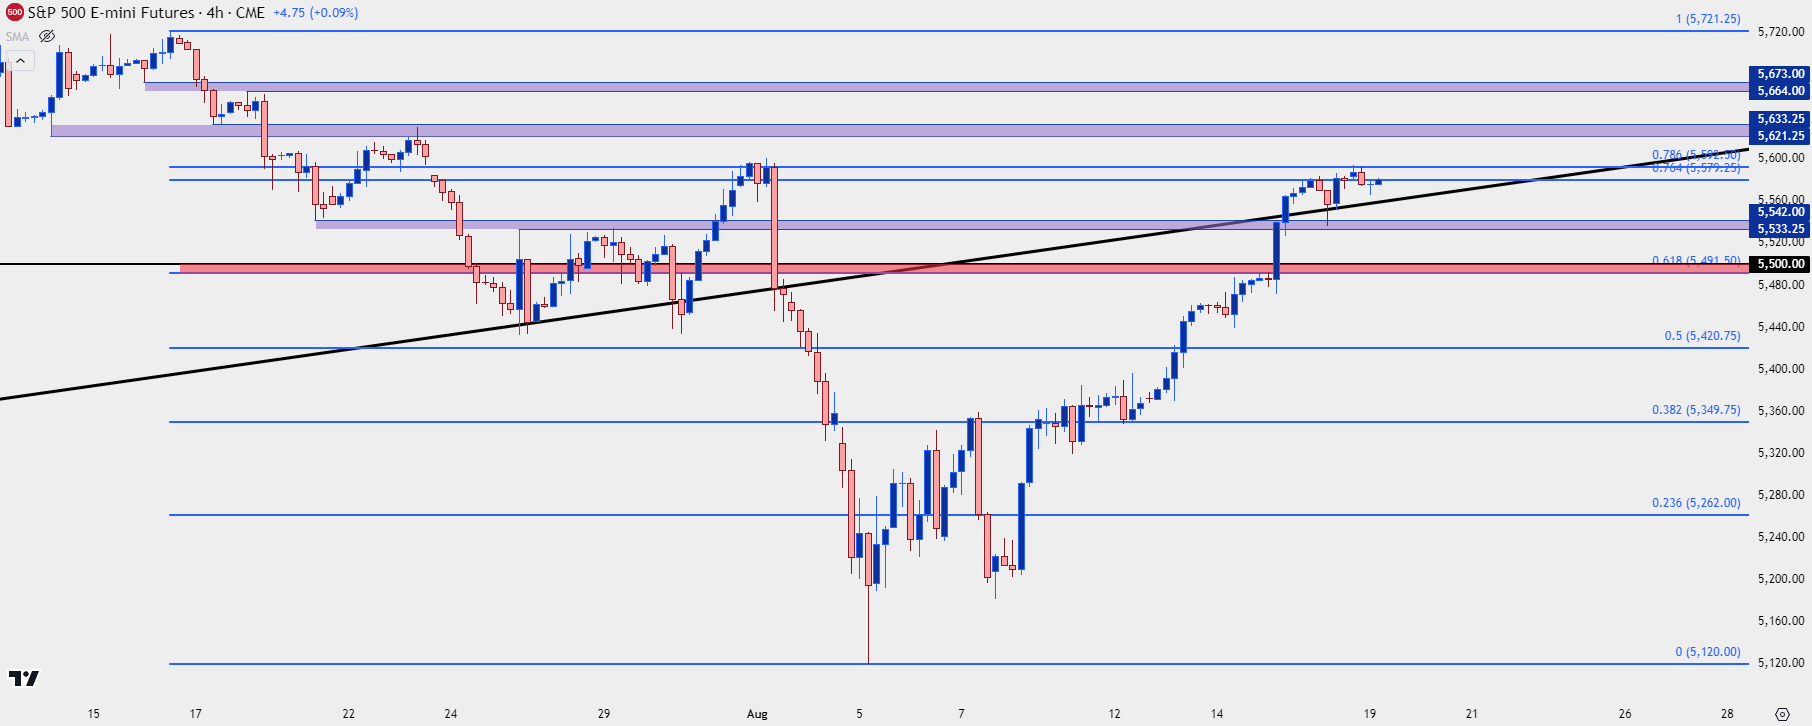
At this point resistance is being held at the 78.6% Fibonacci retracement of the sell-off which is confluent with the longer-term resistance looked at above. While the move is stretched, there’s still no evidence of topping so we can’t completely rule bulls out of making another stretch above current prices.
If so, the next zone of resistance that I’m tracking is an area of support-turned-resistance from 5621 up to 5633, with another from 5664 up to 5673.
For support, 5533-5542 remains important and that would be the first spot that bears would need to push through to begin exhibiting control. Below that, the 61.8% retracement of the sell-off is back in the picture at 5491, which is confluent with 5500. That could be a big spot for bulls to show up in pullback scenarios but if so, there’s lower-high potential in the 5533-5542 area. A hold of lower-high resistance there sets the stage for the possibility of a more sizable retrace of the bullish move that’s built over the past two weeks.
S&P 500 Four-Hour Price Chart
 Chart prepared by James Stanley; data derived from Tradingview
--- written by James Stanley, Senior Strategist


