S&P 500 Talking Points:
- Bulls forced a strong push in the S&P 500 yesterday, erasing early-week losses while trading all the way up to the final resistance zone looked at in yesterday’s article.
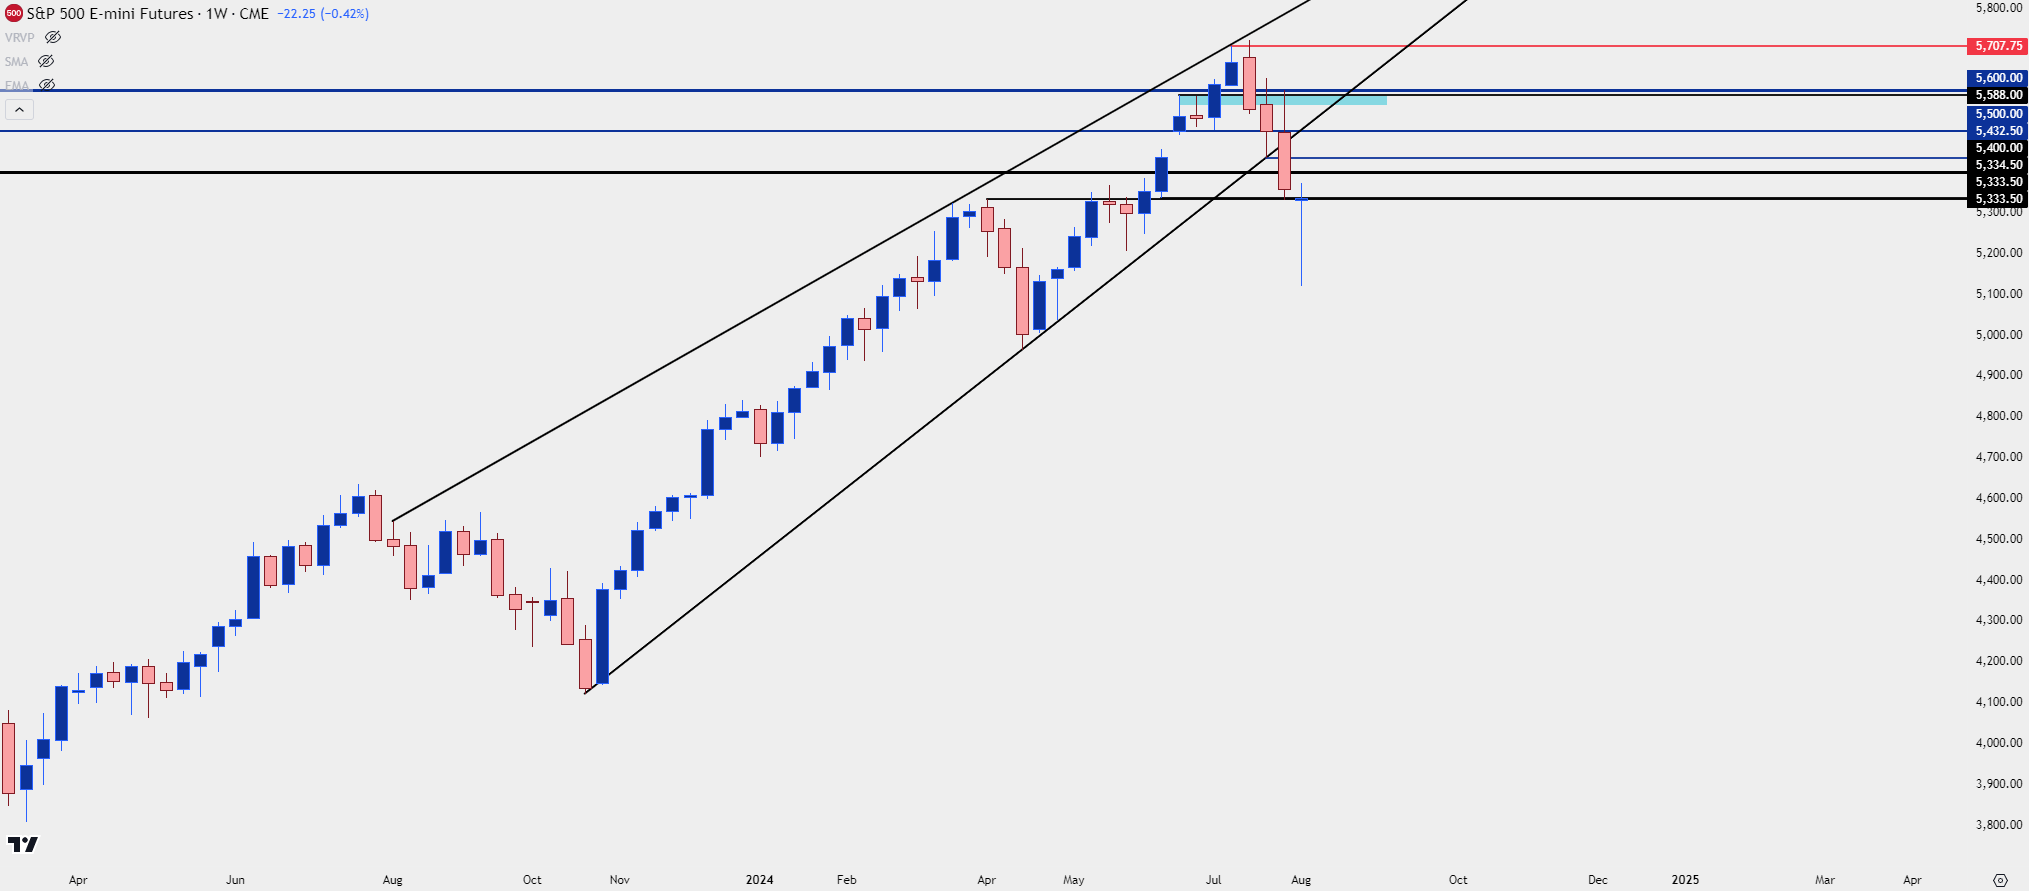
- At this point S&P 500 Futures are showing a dragonfly doji on the weekly and that could turn into a hammer with a strong performance on Friday. That formation is often followed with aim of bullish continuation and a possible sign of a local bottom being in-place.
- This article looks at short-term technical in aim of establishing strategy. To learn more about this type of approach, the Trader’s Course can help. Click here to learn more.
Bulls made a statement in the S&P 500 yesterday as recovery themes showed with a bit more prominence. The pain trade in stocks continued through the weekly open and given failed attempts from bulls on Tuesday and Wednesday, bears retained an element of control into early-trade yesterday.
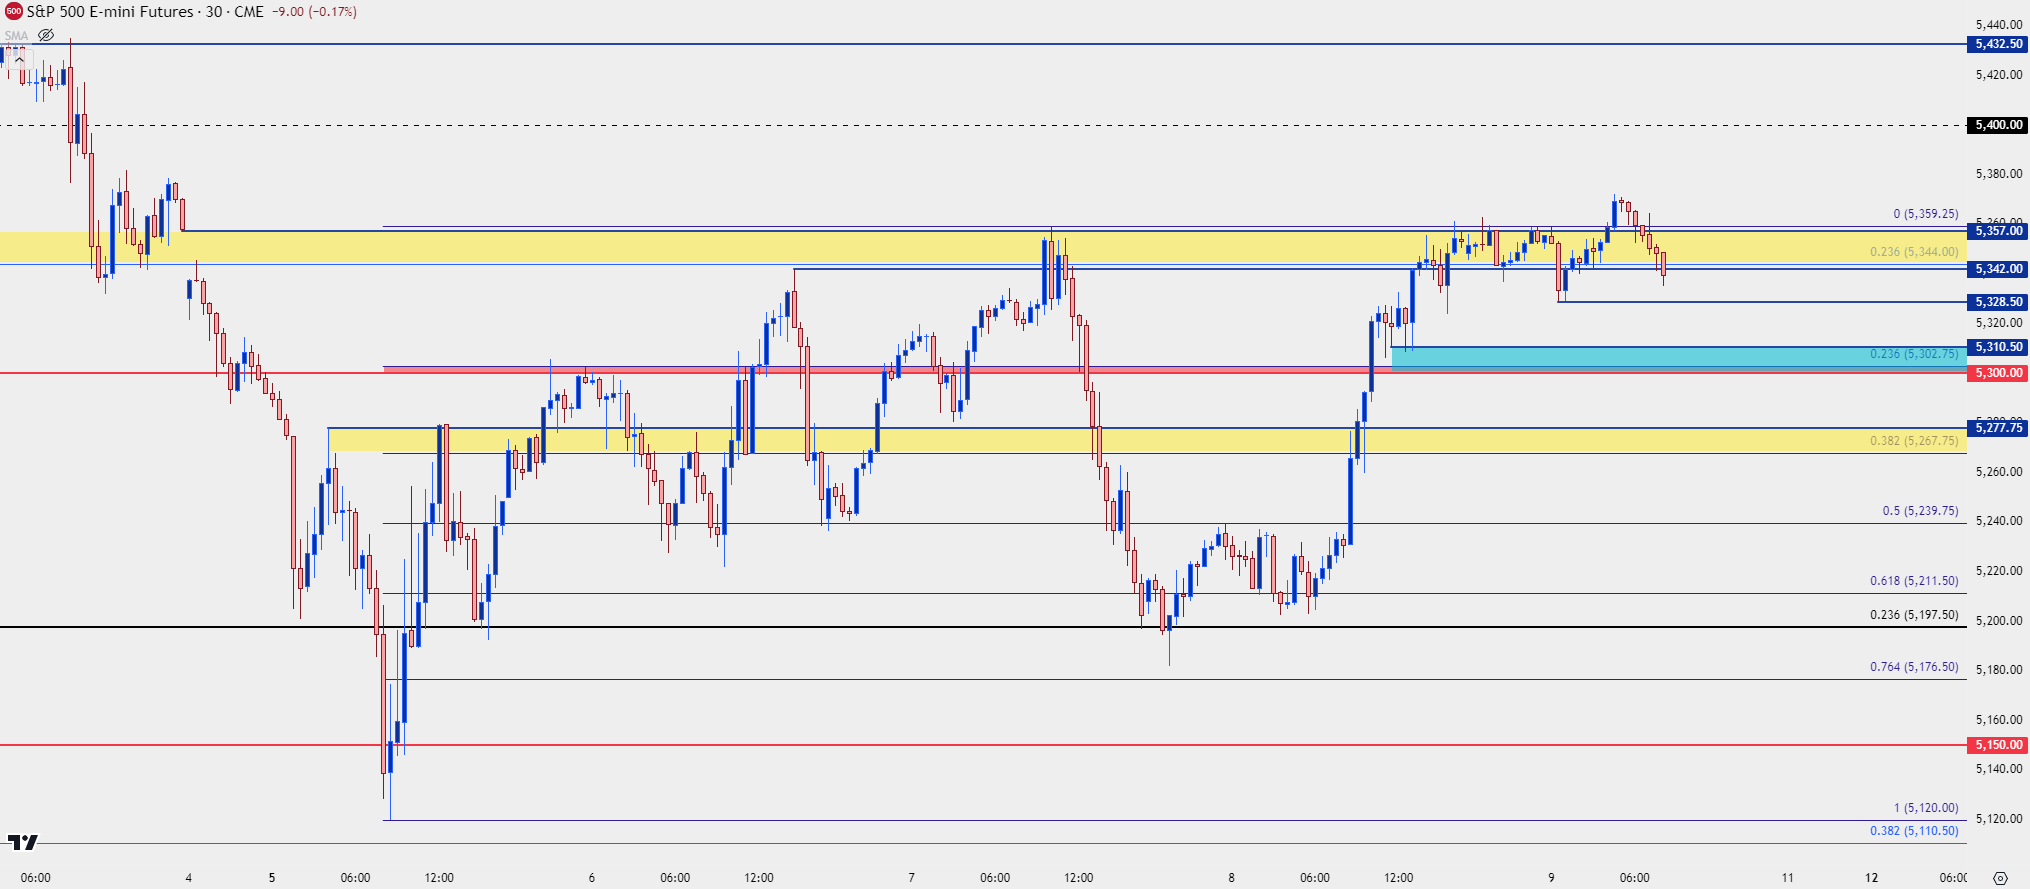
But we then saw another example of ‘good news being positive for stocks’ after initial jobless claim numbers and that helped S&P 500 Futures to rally to the ‘r1’ zone in yesterday’s article at 5,267-5,277, with the move extending through the session until, eventually, the highs held around the final zone of resistance that I had looked at in the 5,342-5,357 zone.
Notably, this was the area of the prior weekly close and the same resistance that had held the highs the day before, eliciting a reversal that ultimately pushed down to a higher-low.
At this point, bulls have grinded to a fresh high overnight. As of this writing, the 5,344-5,357 zone remains in-play and there’s some additional bullish structure of note, such as the overnight swing at 5,328, or the 5,300-5,310 area that held higher-lows during yesterday’s session. And below that, the 5,267-5,277 zone could function as higher-low support, as well.
If bears can force a push below 5,300, that would indicate failure from bulls while opening the door for bears into week-end price action.
For resistance, the top of the zone at 5,357 is the first item of note, followed by the psychological level at 5,400, after which 5,432 comes into the picture.
S&P 500 30-Minute Chart
 Chart prepared by James Stanley; data derived from Tradingview
S&P 500 Daily/Weekly
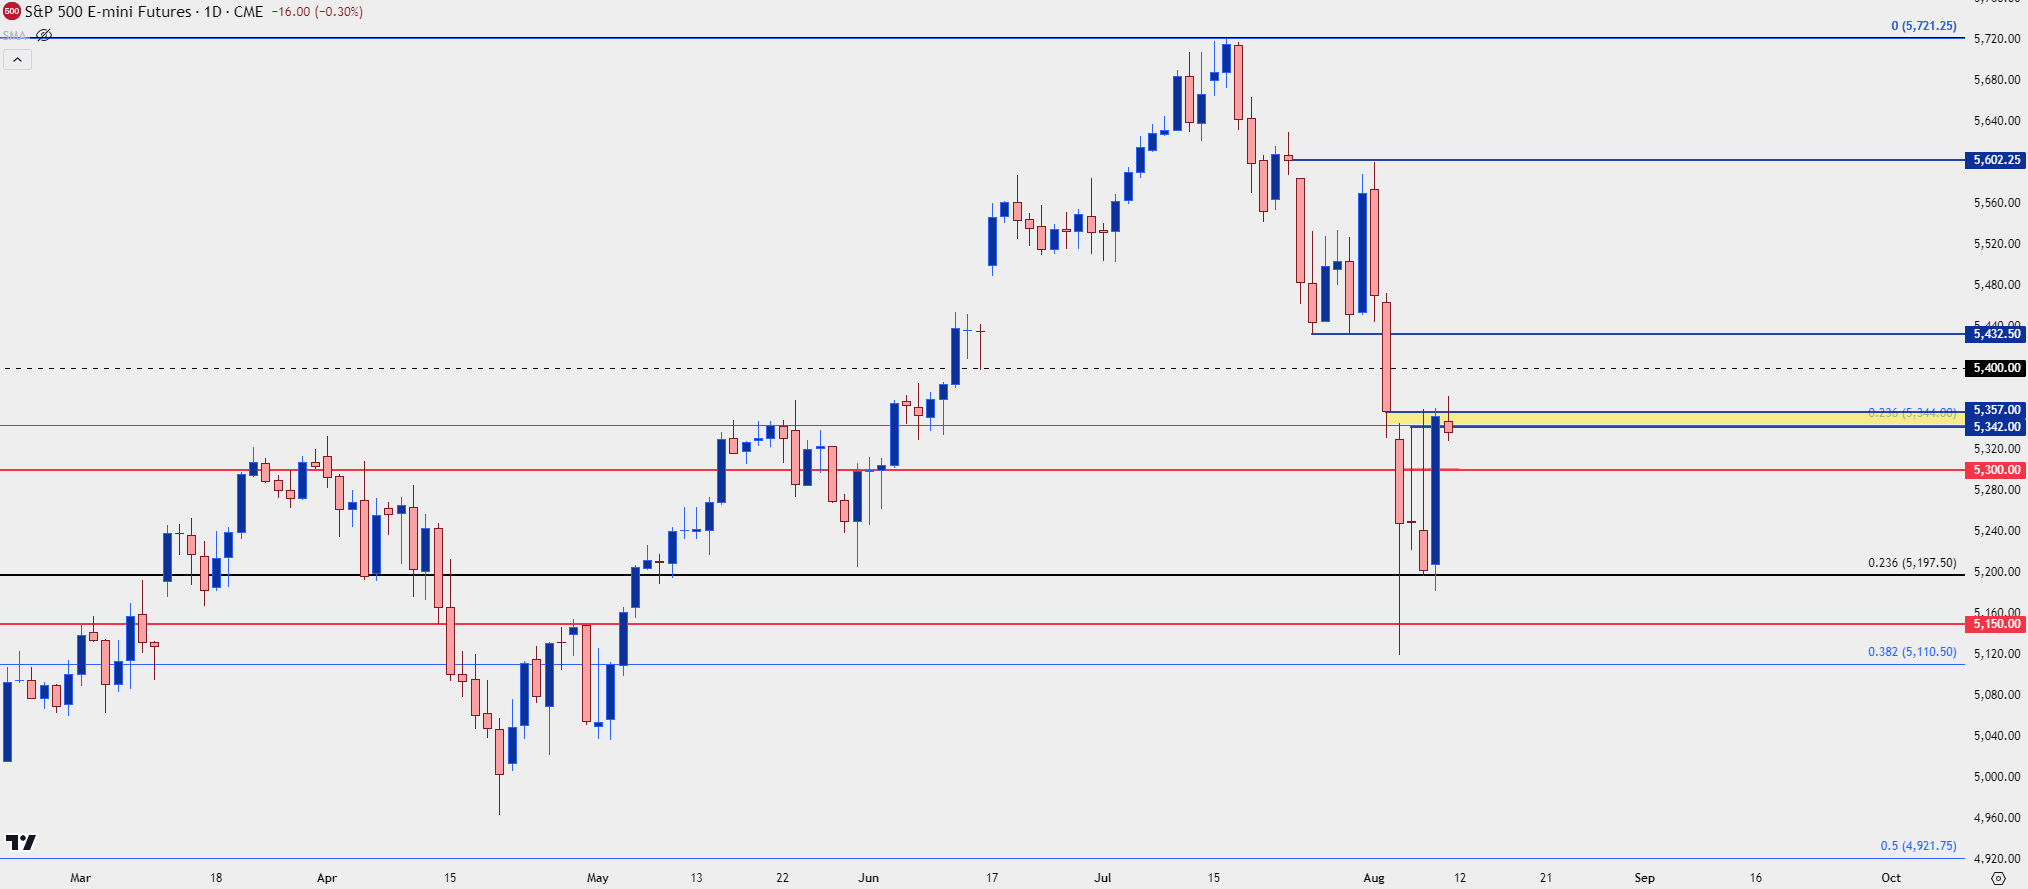
At this point the daily bar illustrates the weekly tone well, along with the importance of the 5,344-5,357 zone that has stalled the advance thus far. Sellers seemed to dominate in the early-part of the week, giving way to the relief rally on Thursday. From short-term charts it certainly appears as though bulls have made a strong push for control, but this must be kept in scope, considering the importance of the current zone of resistance that price is attempting to grind through.
This was support last Friday and has held as resistance throughout this week. So bulls need to make a push today to seize control and that would also entail an interesting bullish formation on the weekly chart, if it does take place.
S&P 500 Daily Price Chart
 Chart prepared by James Stanley; data derived from Tradingview
The weekly chart highlights the importance of today’s price action. At this point the weekly bar takes on the appearance of a dragonfly doji, which is indecisive but may be considered with a slightly-bullish bias. If buyers can force a move-higher today, particularly up to 5,400, then the weekly bar will begin to take on the appearance of a hammer formation which is often approached with aim of bullish reversal. This would not completely obviate the recent rising wedge break, but it would put buyers in position to challenge deeper resistance levels next week as we move towards the US CPI release.
S&P 500 Futures – Weekly Chart
 Chart prepared by James Stanley; data derived from Tradingview
--- written by James Stanley, Senior Strategist


