S&P 500 Talking Points:
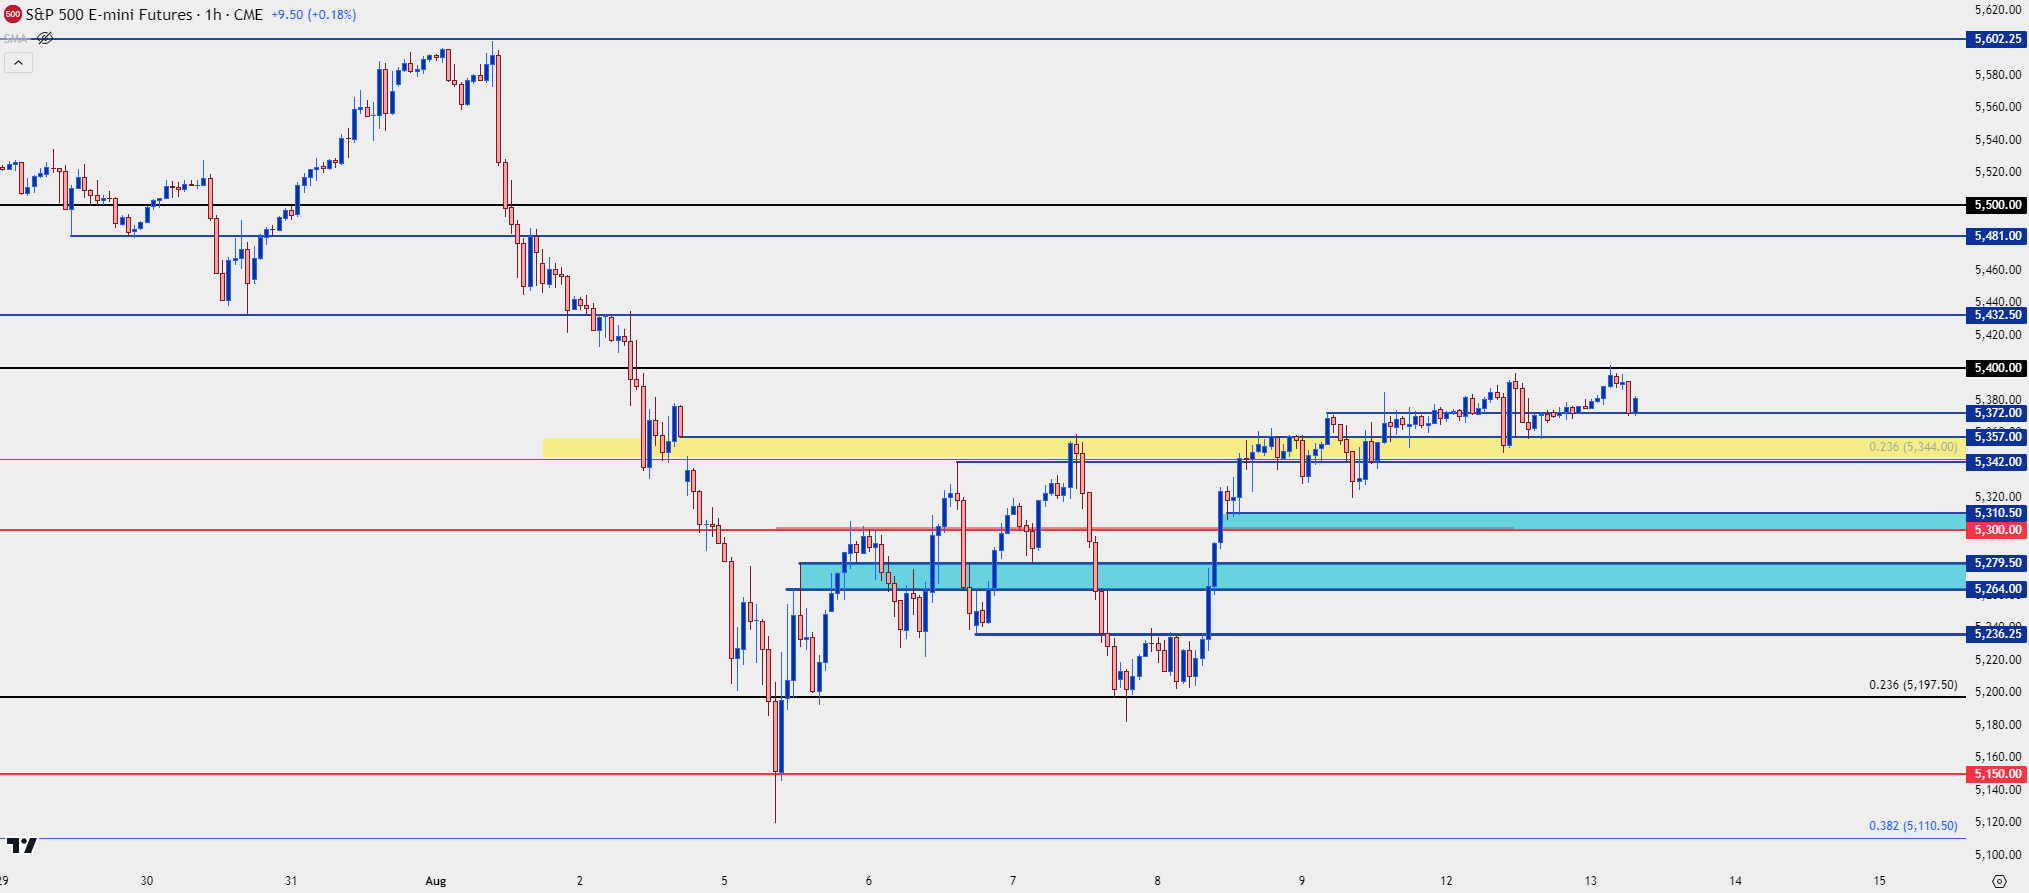
- It was a choppy session yesterday ahead of this morning’s release of PPI data, but there was respect of support at the key zone of 5344-5357, and price tested resistance overnight at 5400.
- The PPI report this morning is the first piece of U.S. inflation data that traders will get to work with on the week and tomorrow brings the more widely-followed report of CPI.
- I’ll be looking into these setups in the Tuesday webinar and you’re welcome to join, click here for registration information.
S&P 500 bulls have continued to show recovery with a hold of key support yesterday. The zone from 5344-5357 was the same spot that held the weekly close two weeks ago and then became resistance over a couple of different instances last week.
For yesterday, it held support in tepid Monday trade and overnight, price bumped up to the ‘r1’ resistance level of 5400 which held resistance. So at this point, technical structure on the S&P 500 remains relatively clean.
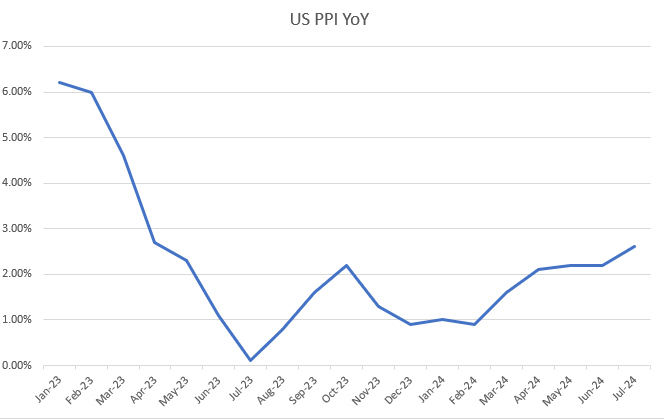
This can change fast, however, as we come into some of the more pertinent U.S. data releases since the NFP report that pushed an aggressive sell-off. This morning brings the release of Producer Prices, often considered a leading precursor to consumer prices and, of late, that data point has been running higher. After pushing below 1% last year, there’s now been four consecutive months of over 2% and last month saw a hearty beat at 2.6% against a 2.3% expectation. The expectation for this morning is at 2.3%.
U.S. PPI Releases Since January 2021

Chart prepared by James Stanley
S&P 500 – Inflation Data
What really brought the bears out over the past month has been a rally in Treasuries as investors try to get in-front of the Fed’s first rate cut since 2020. So, paradoxically, a weaker set of inflation prints may bring out drive for sellers in stocks whereas most investors would probably consider that softer inflation a ‘good’ thing for equities.
Nonetheless, structure matters, and below I’m going out with a bit more scope given the oncoming data.
Resistance remains at the same 5,400 as yesterday, with 5432.50 and 5481 overhead, followed by the 5,500 psychological level.
Given the grind-higher of late there’s considerable support structure underneath current price and the first main zone is the same already referenced, spanning from 5344-5357. Below that, 5300-5310 and that’s followed by 5267-5279.50. The 5200 level helped to provoke the pivot last week and that, along with 5,150, remain big support levels sitting below current price.
Resistance:
R1: 5,400
R2: 5432.50
R3: 5481
R4: 5500
Support:
S1: 5342-5357
S2: 5300-5310.50
S3: 5264-5279.50
S4: 5197.50
S&P 500 Hourly Price Chart
 Chart prepared by James Stanley; data derived from Tradingview
--- written by James Stanley, Senior Strategist


