S&P 500, Nasdaq Talking Points:
- This is an update to the article I had published just before the FOMC rate decision, highlighting levels in the S&P 500 and Nasdaq 100.
- Today’s rate decision was along the lines of what I highlighted in the Tuesday webinar: Jerome Powell laid the groundwork for rate cuts to begin in September, and he kept the door open for additional cuts into the end of the year.
- At this point, both S&P 500 and Nasdaq 100 Futures are showing their strongest single day rally since November of 2022, just after the low was set. This is in stark contrast to the panic that had started to show last week.
- The week isn’t over yet: Tomorrow brings a Bank of England rate decision along with Apple and Amazon earnings after the bell. And the Friday NFP report is perhaps even more important after today’s Fed meeting, with the unemployment rate a particularly important data point to watch. That has disappointed over the past three months while climbing from 3.9% to 4.1%, and the expectation for Friday is another 4.1% reading.
It was a ‘thread the needle’ meeting for Jerome Powell and, at this point, judging by markets’ reaction, he did just that. Both S&P 500 and Nasdaq 100 Futures are showing their largest single-day rallies since November of 2022
Expectations remain incredibly high for a Fed pivot into rate cuts at their next meeting in September and the challenge for Powell today was walking that tripwire of moving towards a rate cut without sounding too dire about the economy, which could, potentially, create even more panic.
It was just a week ago that panic had already started to spread, with fear that the AI-bubble was popping after Google gapped down following their earnings report. Even yesterday, at the close, when Microsoft and AMD released earnings, stocks were on their back foot.
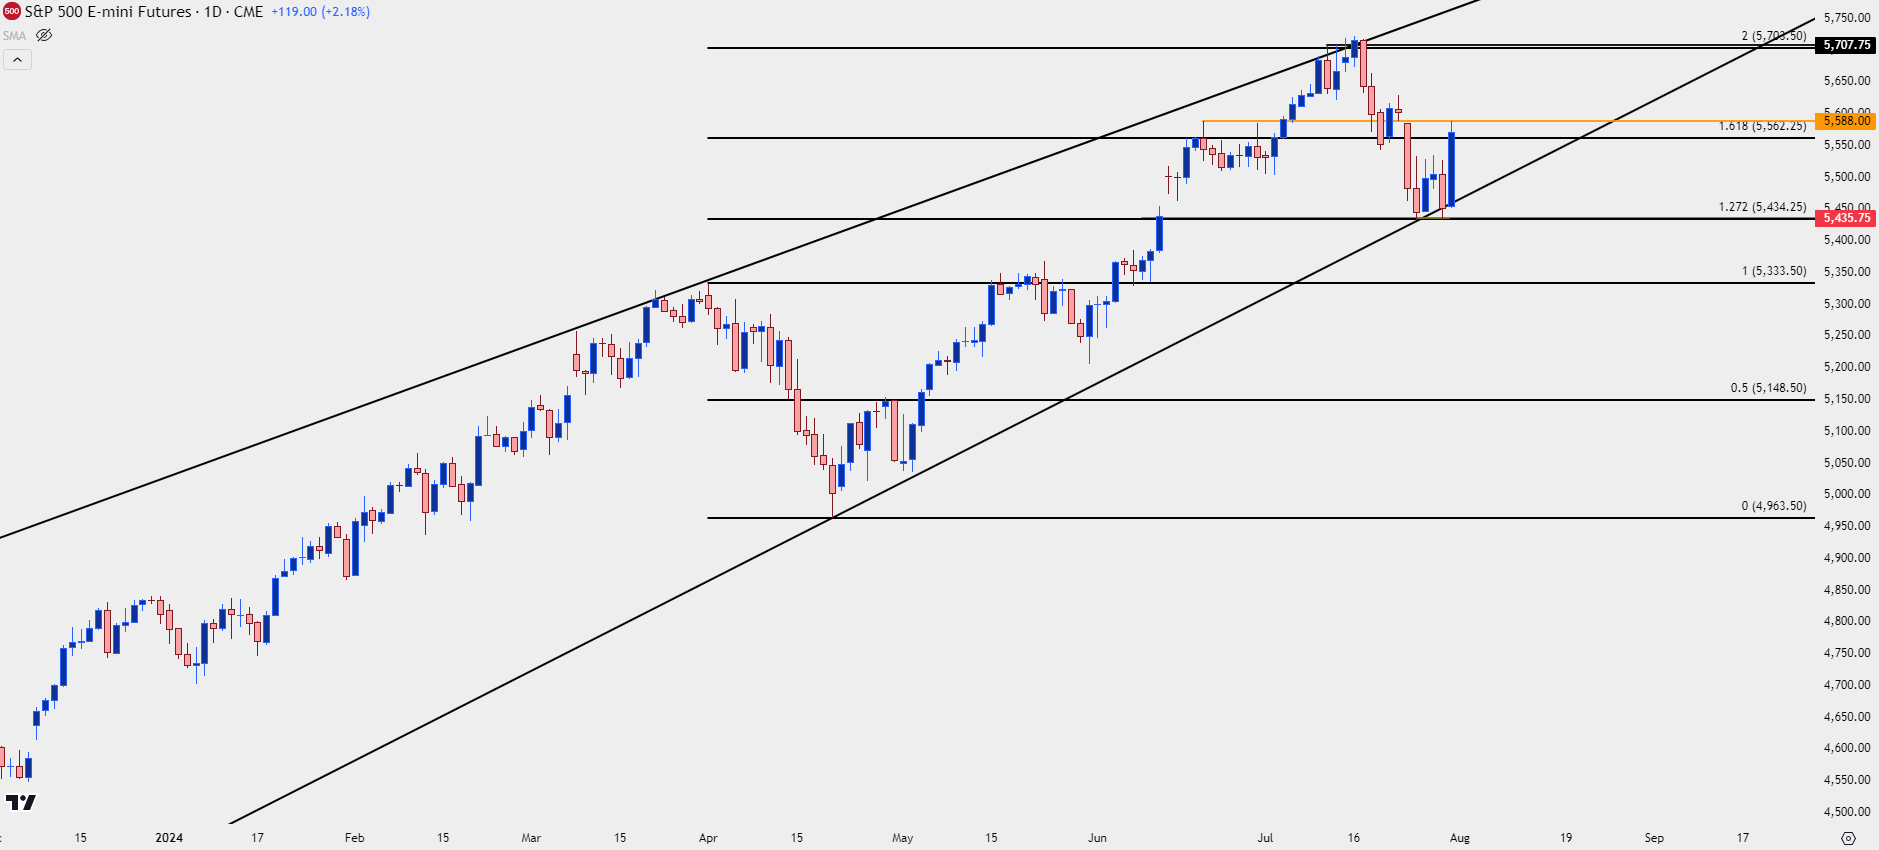
The S&P 500 re-tested a major area on the chart at 5,434 and this has a few different items of note, as this is a Fibonacci extension as well as a prior price action swing, and it’s also confluent with the support side of a rising wedge pattern. I had highlighted this last week after it initially came into play to hold support, and it had a second inflection yesterday.
Since then – S&P 500 futures have put in a rally and price tested the top-end of the resistance zone that I’ve been tracking at 5588.
S&P 500 Daily Price Chart
 Chart prepared by James Stanley; data derived from Tradingview
With the Fed in the rearview attention can now focus on drivers remaining on this week’s calendar. For equities, it’s the Apple and Amazon earnings calls tomorrow followed by the Non-farm Payrolls report on Friday.
Given Powell’s persistence that labor market data would be a key driver of any future moves, the unemployment rate in that report becomes a more important variable. It’s been disappointing over the past three months, each coming in above expectations with a 3.9%, 4.0% and 4.1% read. The expectation for Friday is 4.1% but if this prints above-expectation again, then that gives a bit more confidence that the Fed will be looking at a cut for the September meeting.
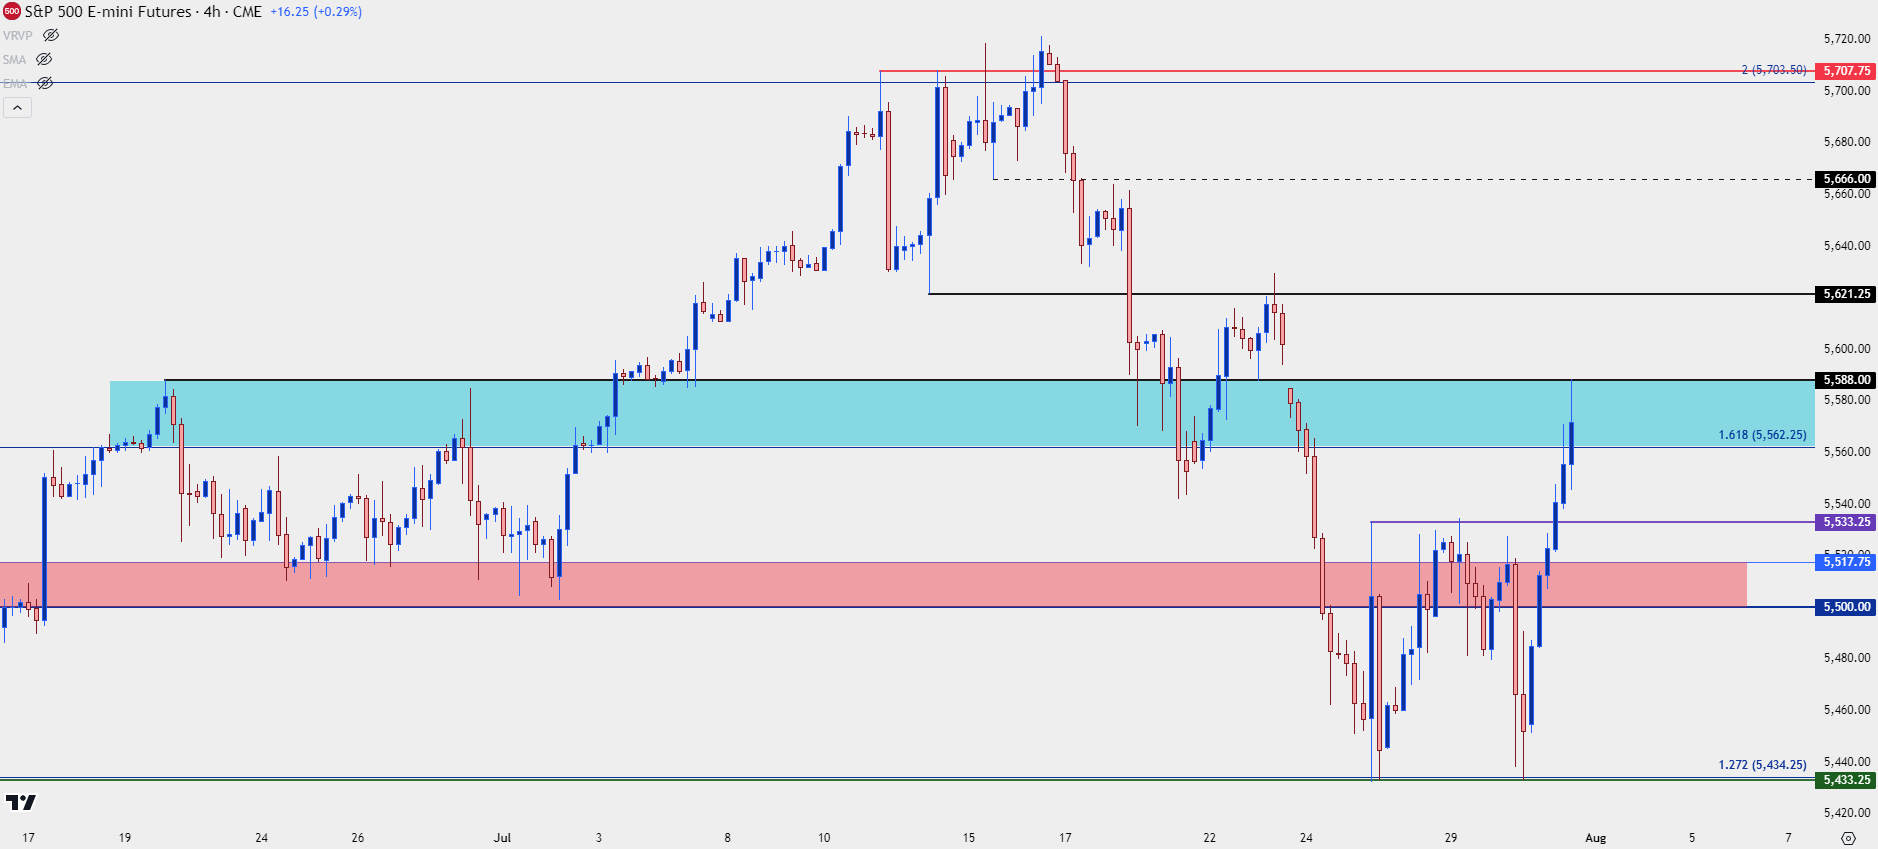
In the S&P 500 there was a double bottom formation with that second hold of support at 5,434, and that formation has now been triggered with today’s breakout. Given the approximate 100 point differential from the bottom to the neckline, that implies a possible topside resistance level around 5,633.
But – before that can come into play, bulls are going to need to deal with the 5,558 level that I’ve been talking about which has, so far, held today’s high.
There’s now support potential at 5,533, 5,517 and 5,500.
S&P 500 Four-Hour Price Chart
 Chart prepared by James Stanley; data derived from Tradingview
Nasdaq
Given the pressure point of tech stocks that sold off over the past couple weeks, the Nasdaq was in a more precarious state as of late yesterday. Prices set a fresh monthly low after the MSFT and AMD earnings releases but, similar to the above in S&P 500 Futures, bulls came back in a big way today.
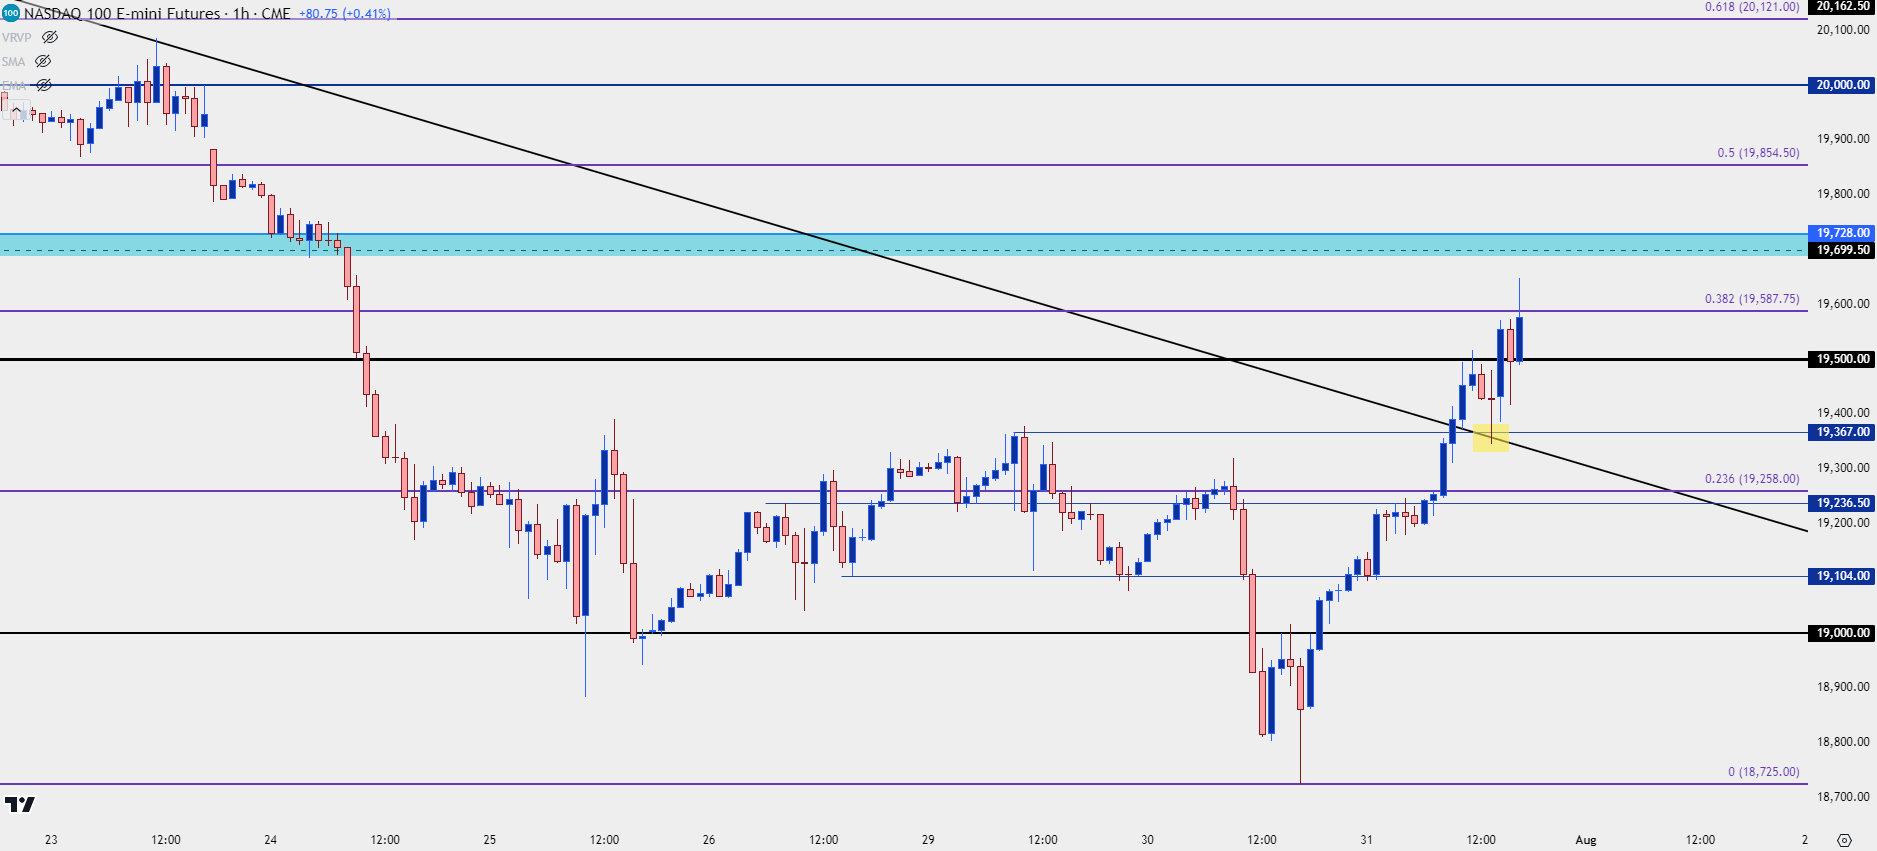
In the article published just ahead of the FOMC meeting, I had highlighted three different support levels. It was the ‘s1’ level that came into play just ahead of the statement release, and this was confluent with a prior bearish trendline at the time.
This functioned like a springboard as bulls showed up to re-take the 19,500 level, and at this point, price has made a strong push towards the 19,700 zone.
Nasdaq 100 Futures – Hourly Price Chart
 Chart prepared by James Stanley; data derived from Tradingview
Nasdaq Bigger Picture
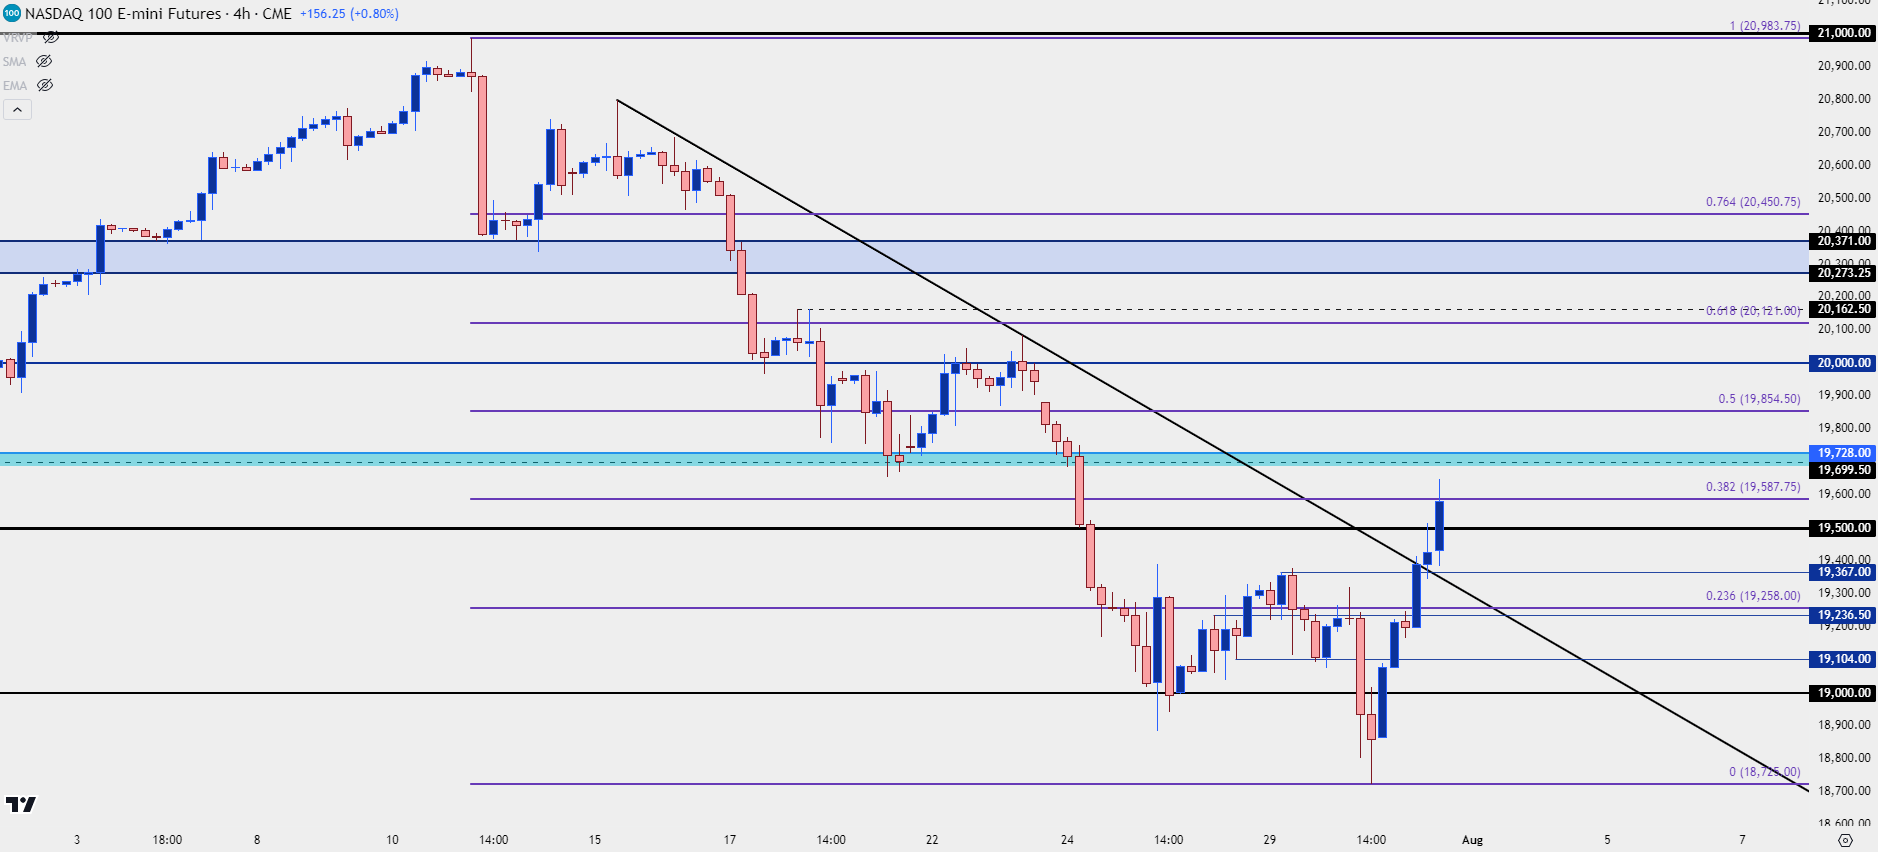
The Nasdaq did not have great support structure ahead of today’s rally, unlike the double bottom looked at above in the S&P 500. So, bulls still have some work to do here to re-take control of the trend and the drivers remaining on the calendar can certainly make this happen. There’s also been a hold of resistance at the 38.2% retracement of the pullback – which qualifies today’s move as a possible pullback in a broader bearish theme, although that can change if buyers can power-through with Amazon and Apple earnings on the calendar for tomorrow.
The big zone that I’m tracking overhead is the 19,700 area that had helped to set support in both June and July, with sellers finally taking that out last week. Above that, the 20k level still looms large. For support, the 19,500 level remains of interest and for topside scenarios, bulls would likely want to see that defended to keep the short-term sequence of higher-highs and lows intact.
Nasdaq Four-Hour Price Chart
 Chart prepared by James Stanley; data derived from Tradingview
--- written by James Stanley, Senior Strategist


