S&P 500, Nasdaq 100 Talking Points:
- Sellers returned in US equities yesterday after a weak auction of 10 year Treasuries.
- So far, the pain in equities has held at a higher-low than the Monday morning swing low, with S&P 500 Futures holding support at the Fibonacci level at 5,200.
- This article looks at short-term technical in aim of establishing strategy. To learn more about this type of approach, the Trader’s Course can help. Click here to learn more.
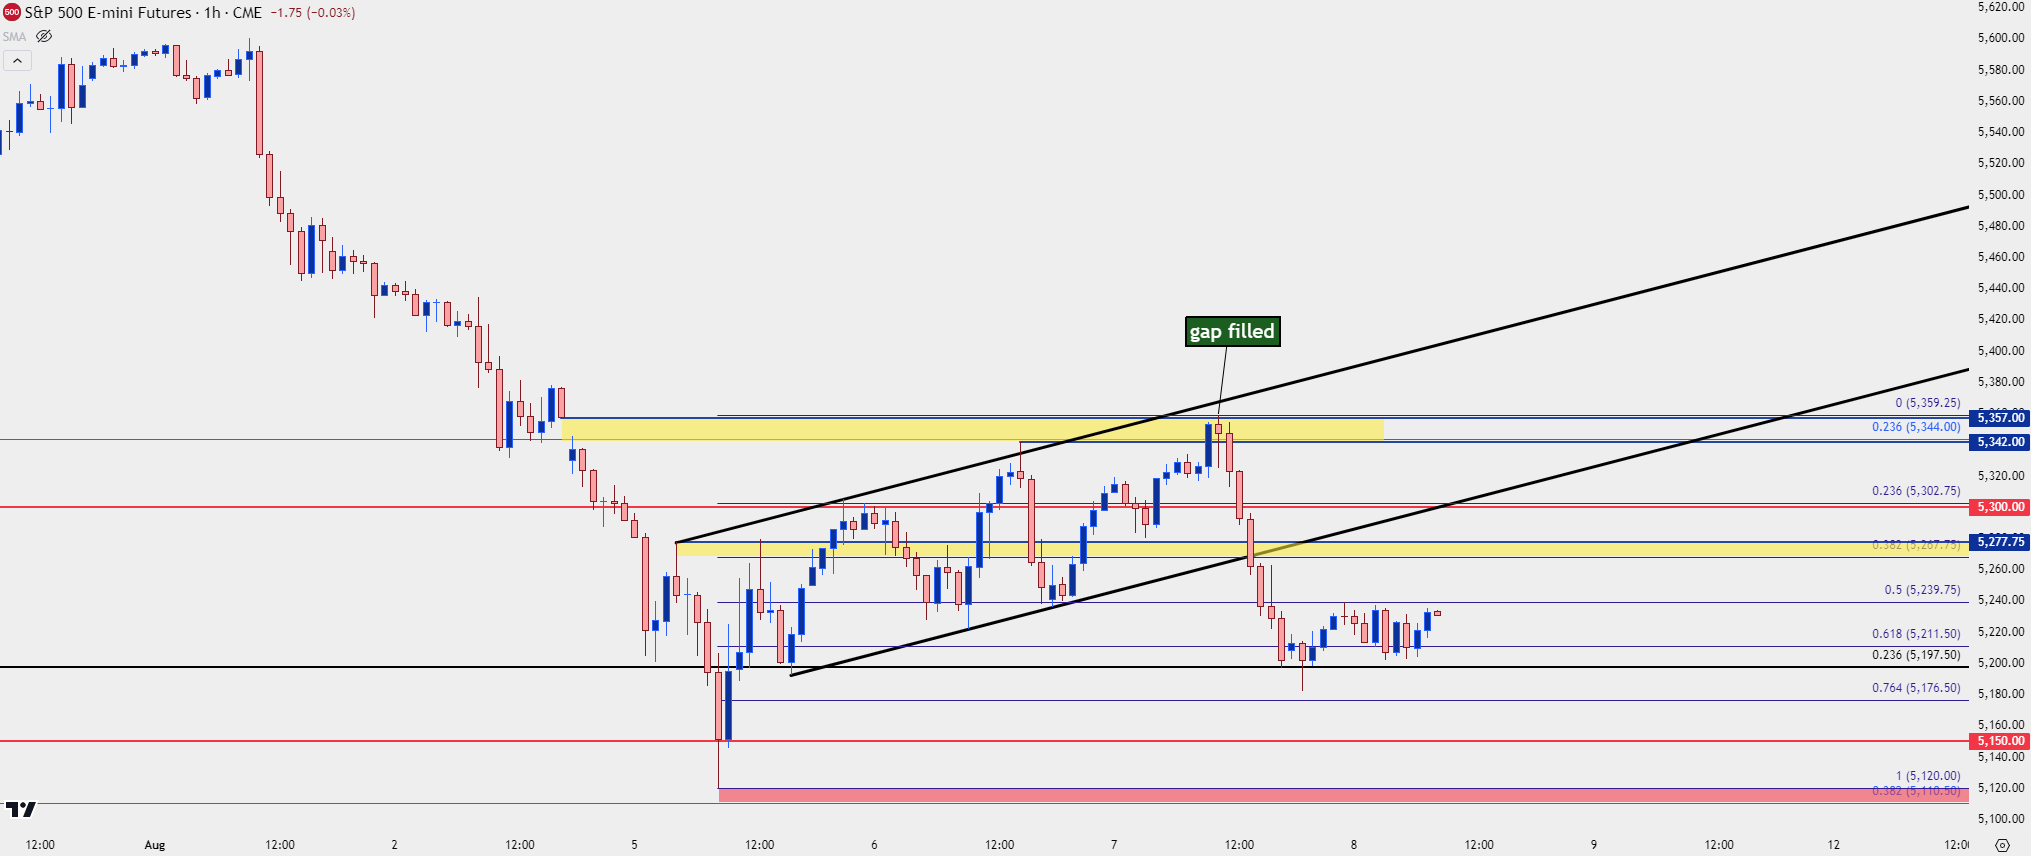
The exuberance of Tuesday’s rally was washed away with another strong sell-off yesterday. A weak 10-year Treasury auction is being cited across many media sources and that did likely play some element of a role. But – the technical backdrop remains fairly clean and the fact that the sell-off in ES hit just after the weekly opening gap had filled highlights that a technical factor was also at-play.
I had highlighted this zone in the Tuesday webinar, running from the Fibonacci level at 5344 up to last week’s close at 5,357. The latter level traded shortly after yesterday’s US equity open and after, sellers emerged and re-took control of near-term price action. And they forced a pretty harsh sell-off, all the way until support came into play at the longer-term Fibonacci level of 5,200.
S&P 500 Futures: 30-Minute Chart
 Chart prepared by James Stanley; data derived from Tradingview
From the hourly we can get better context on the near-term backdrop: That 5197/5200 support hold has since led to a grind of support at the big figure; but there does remain an element of bearish control from sellers as indicated by the downside breach of what can be construed as a bear flag formation.
So sellers could quickly push down to fresh lows and given another Treasury auction on the calendar for today, the backdrop for such exists.
Key support plots from 5110-5120, with levels at 5150 and 5176 before the 5197/5200 zone comes into play.
Resistance is perhaps more interesting, however, given the reaction yesterday, and where or how hard sellers react to resistance could be telling for directional drives. There’s a short-term spot of resistance at 5240, which is the 50% retracement of the Monday-Tuesday bounce. Above that, the 38.2% Fibonacci retracement of the same study plots just 10 handles below the 5277 level that I’ve been tracking. And that’s followed by a confluent zone at 5300 before prior key resistance at 5344-5360 comes into the picture.
S&P 500 Futures – Hourly Chart
 Chart prepared by James Stanley; data derived from Tradingview
--- written by James Stanley, Senior Strategist


