S&P 500 Talking Points:
- U.S. equities continued the near-term rally yesterday following inflation data.
- The 2.9% print for headline CPI hit the ‘goldilocks’ level that I had referred to yesterday which gave bulls reason to continue the push. The big question now is how a resistance test at the key level of 5500 fares.
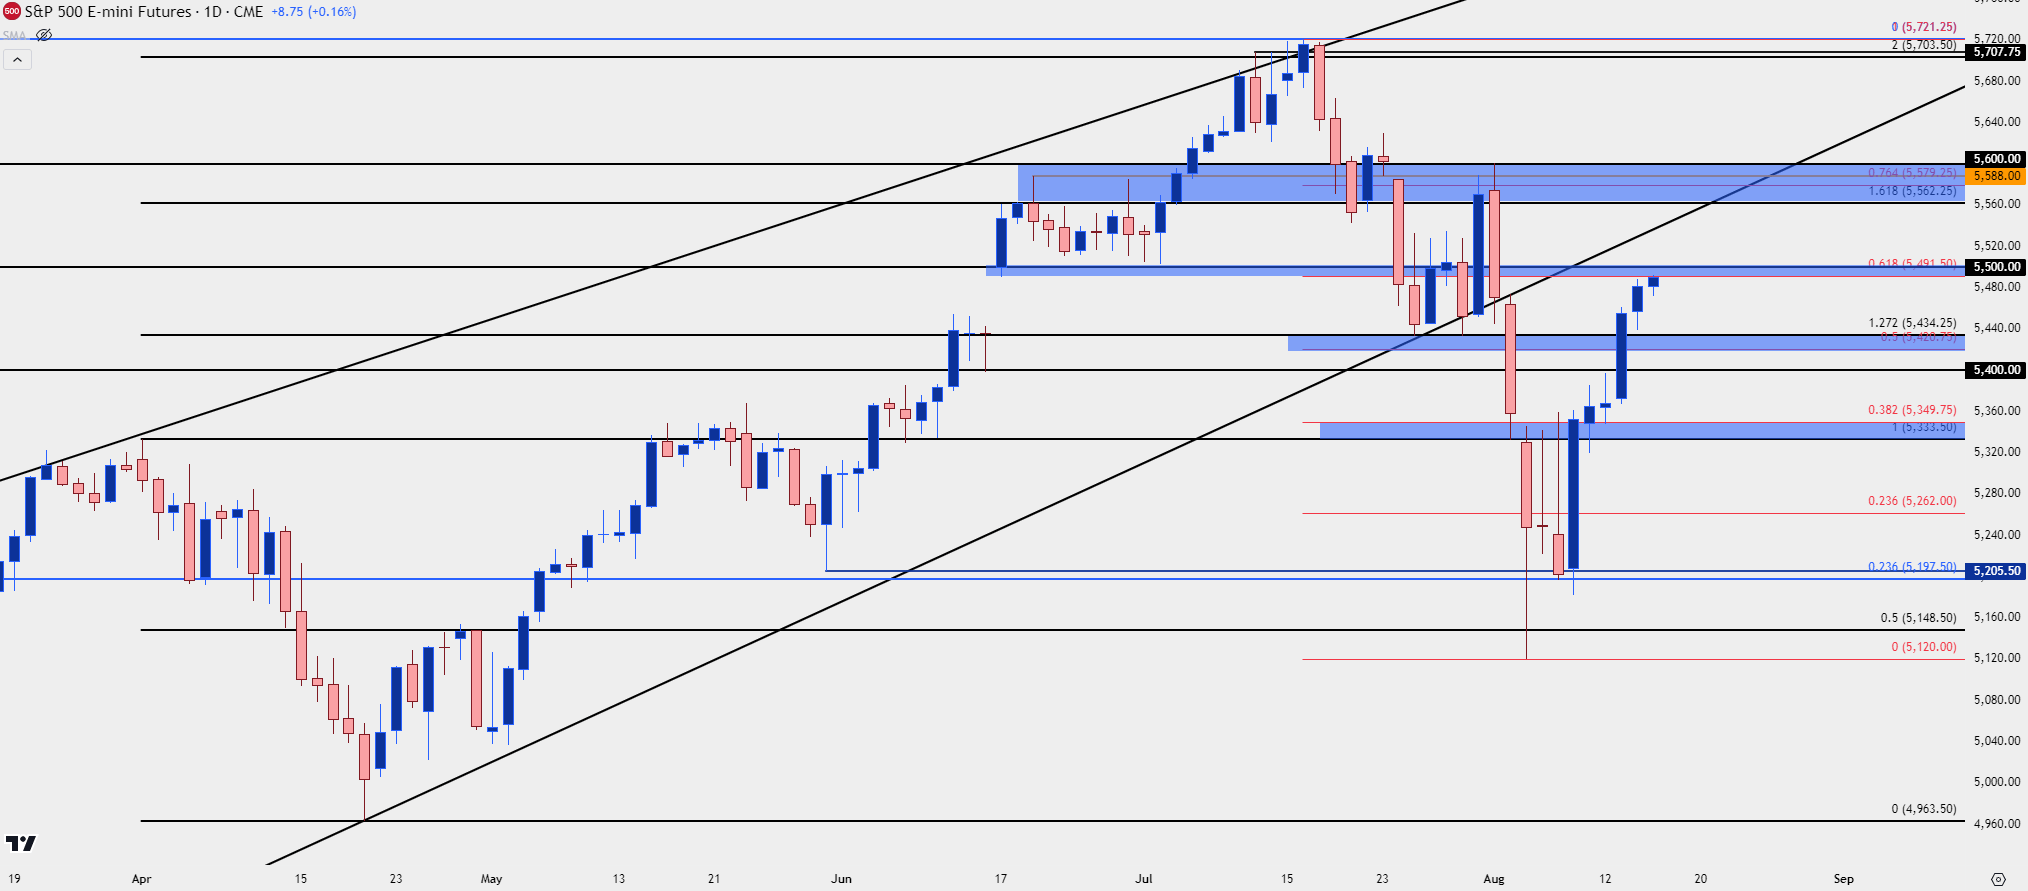
- The rally in S&P 500 futures is now a week old and has already erased 61.8% of the sell-off that started in July. That level marks the lower-end of a resistance zone that I’m tracking up to 5,500 looked at in yesterday’s article.
Stocks continue to show signs of recovery and at this point the rally is a week old. Last Monday started with pain but it’s now looking as though that was the peak of panic for this episode as VIX has continued to recede and equities have continued to claw-higher.
Equities are still not out of the woods yet, however, as recession fears could bring a bid back into Treasuries particularly if U.S. data shows more signs of disappointment. Later this morning we get Retail Sales data and the reaction to that could be telling, as that’s an early-look at consumer behavior for the most recently completed month.
In S&P 500 Futures, the CPI report from yesterday prodded a move up to the resistance zone that I had looked at from 5491-5500, with the former price functioning as the 61.8% Fibonacci retracement of the July sell-off. The latter is perhaps even more important as it’s a psychological level that had held support for a couple of weeks before buyers were able to force another fresh all-time-high.
There’s also the consideration of positioning: When the sell-off hit last Monday there were a lot of shorts that likely wanted to cover after a fast and aggressive move. This helps to explain the grind that showed on Tuesday and Wednesday. Last Thursday brought a bid to stocks on the back of initial jobless claims data and that led into what appears to be a short squeeze. The question now is who wants to buy stocks at 5500 on ES, and we’re close to finding an answer to that question.
S&P 500 Futures Daily Chart
 Chart prepared by James Stanley; data derived from Tradingview
S&P 500 Shorter-Term
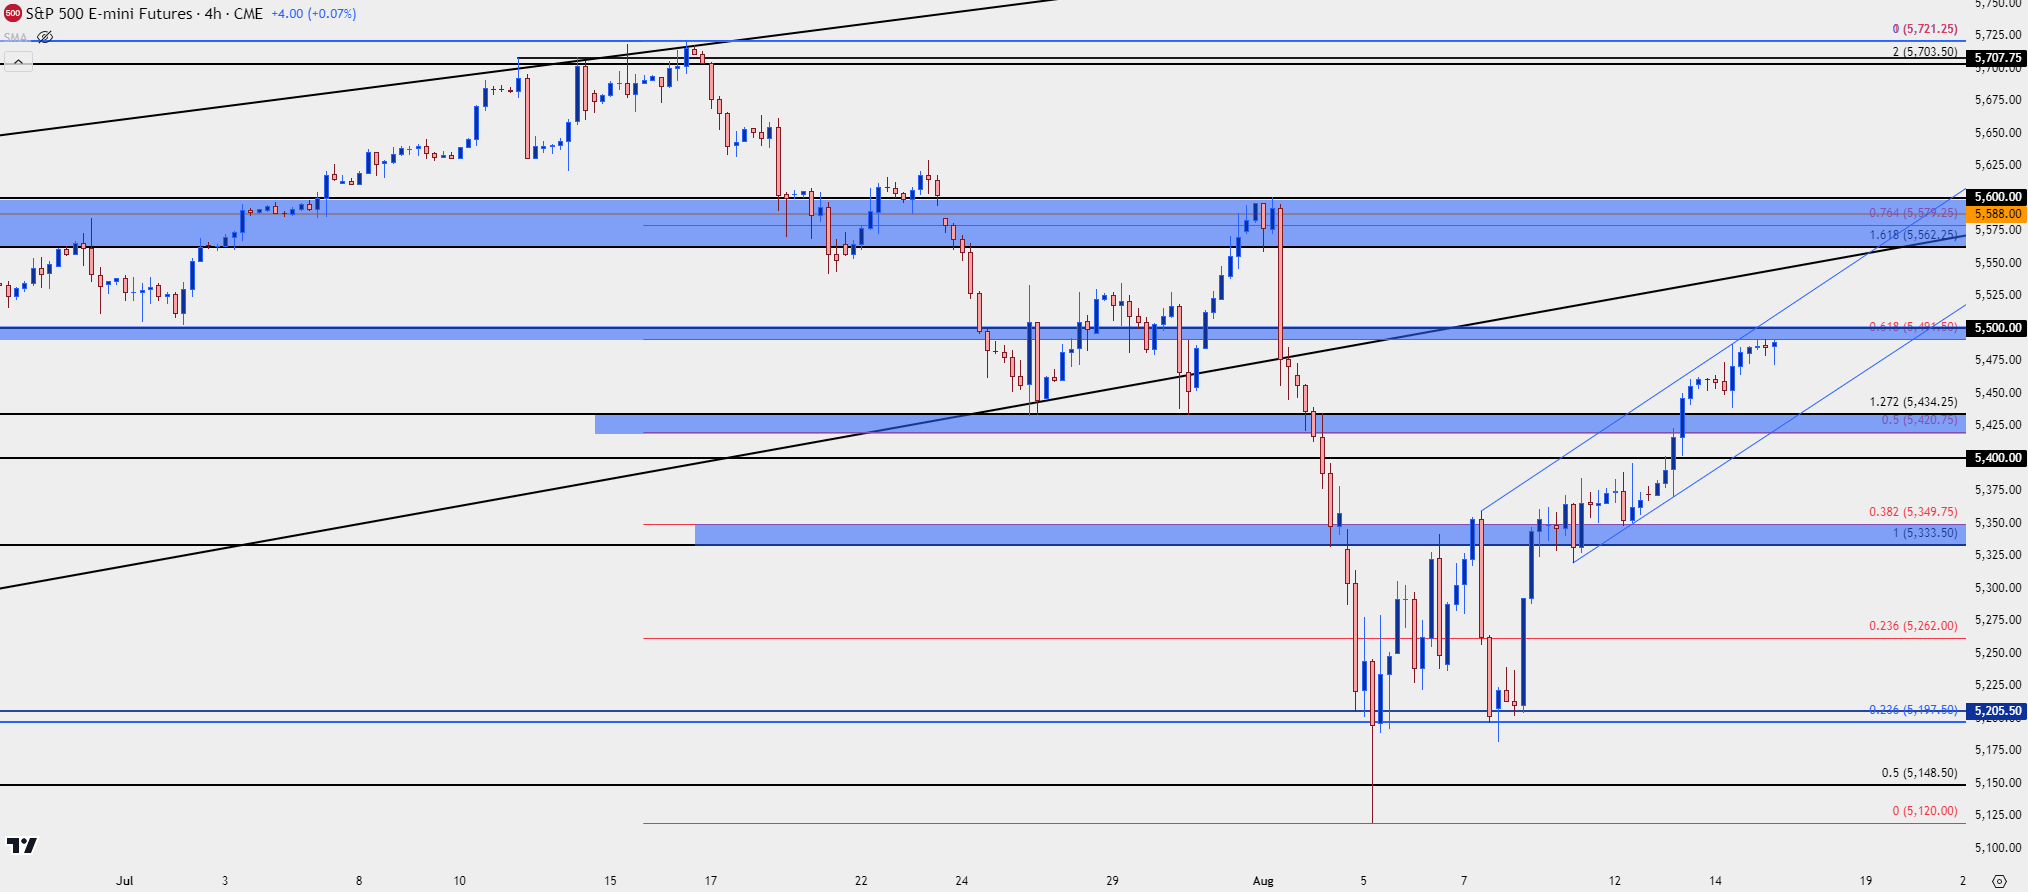
A healthy trend has two sides: As buyers load up with prices moving higher, profit taking compels supply into the market which leads into pullbacks. But – it’s the show of higher-low support that indicates bullish continuation potential and that’s what helps to build a healthy trend.
We saw that in the other direction when stocks were going down, as lower-lows were being followed by lower-highs. But so far in this bullish move over the past week, action has appeared to be quite one-sided.
With price now holding a major spot of confluent resistance, sellers have an open door, whether it’s bulls paring long positions or shorts trying to open fresh exposure, and it’s the response that that will give some idea of continuation potential.
Above current resistance is another confluent zone, spanning from 5562-5600, with a Fibonacci level at 5579.25. Below current price is a spot for bulls to show their hands if they remain aggressive, plotted from 5420-5434. Below that, 5400 and the prior resistance zone from 5333-5350 come into play. If that final support zone comes into the picture by the end of the week, it would be a big move from sellers and something that would further bring question to longer-term continuation potential.
S&P 500 Futures Four-Hour Chart
 Chart prepared by James Stanley; data derived from Tradingview
--- written by James Stanley, Senior Strategist


