S&P 500 Talking Points:
- U.S. Equities continued their rally with an 8th consecutive green day for S&P 500 Futures.
- The S&P 500 is now less than 2% away from the all-time-high that was established last month and there’s an abundance of support structure as taken from prior resistance.
- I’ll be looking into these setups in the Tuesday webinar and you’re welcome to join, click here for registration information.
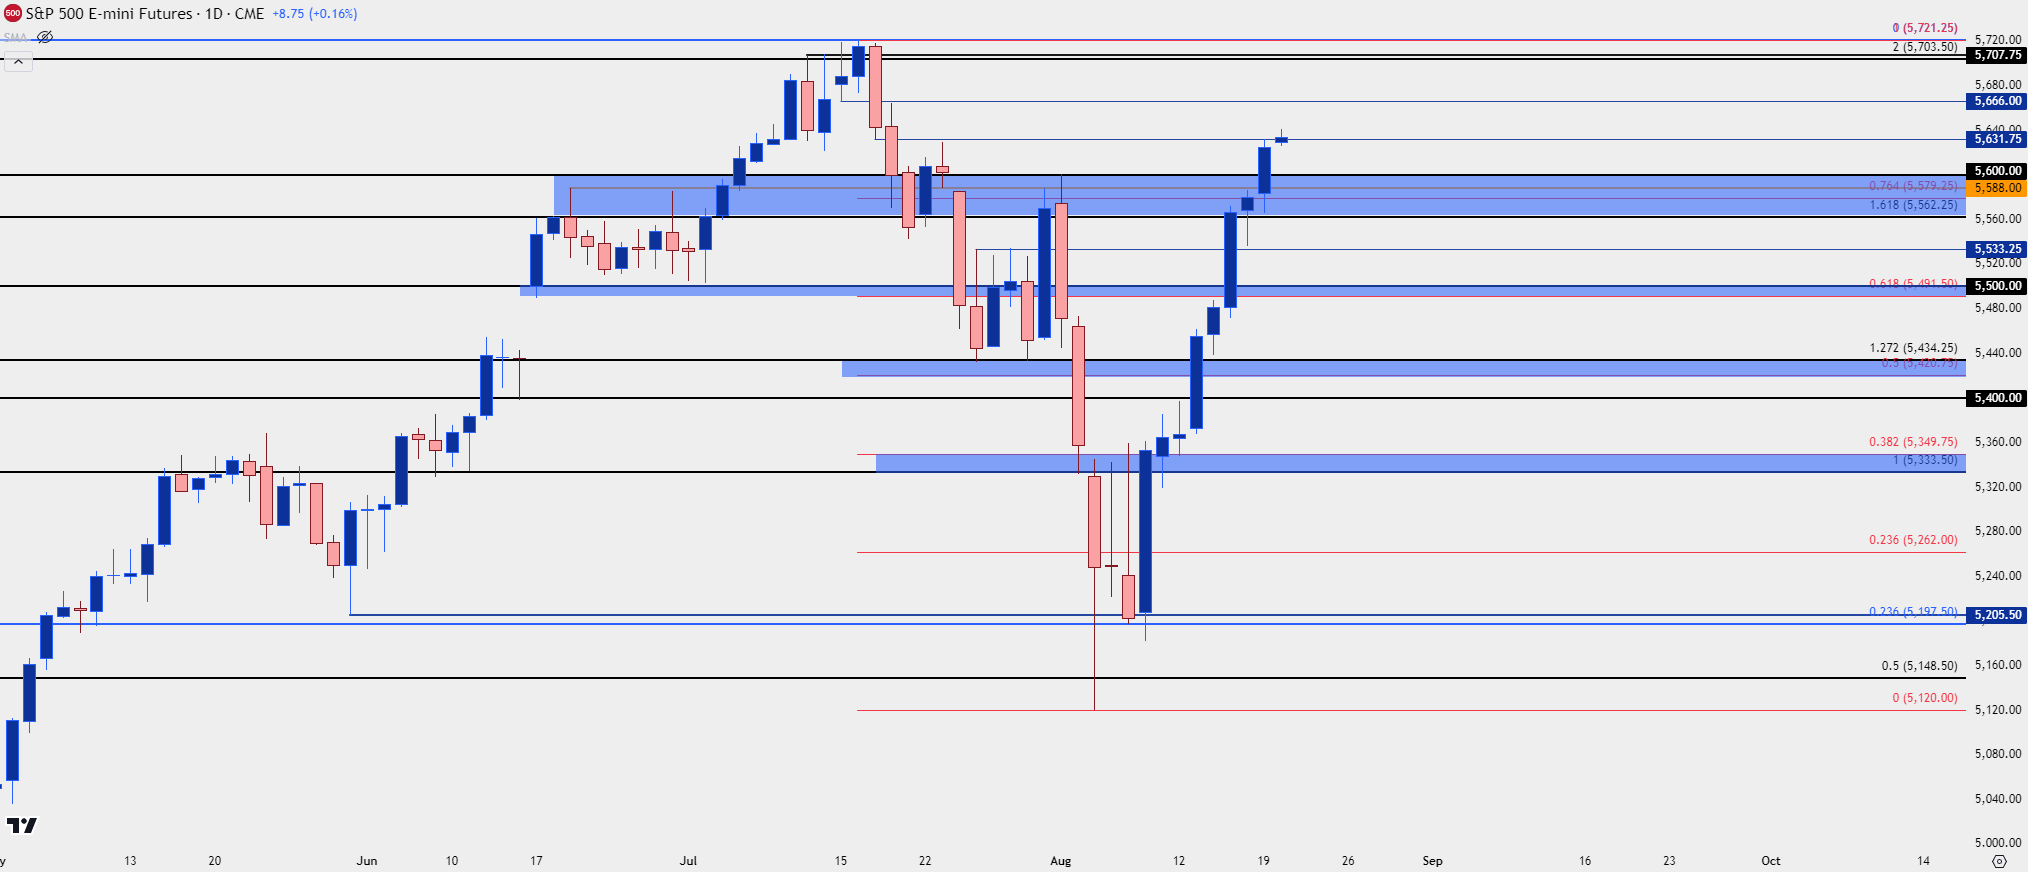
The S&P 500 has continued the rally and yesterday marked the 8th consecutive green day for the index since the 5200 test two weeks ago.
As of this writing, ES is right at the 5631 level looked at yesterday following another strong move from the daily chart. No resistance has been able to temper the rally as yesterday’s trade saw bulls grind through a key zone of prior resistance, which now becomes support potential. This spans from the 5562-5600 zone and had functioned as resistance in June before attempting to show support when prices began to turn in mid-July. It then became resistance again in early-August as sellers took over for a brief period.
S&P 500 Daily Price Chart
 Chart prepared by James Stanley; data derived from Tradingview
S&P 500 Strategy
At this point it seems that traders are largely looking to the latter portion of this week’s calendar. Tomorrow’s Fed minutes release is followed by the start of Jackson Hole on Thursday, with Chair Powell giving a speech on Friday that will likely garner considerable attention.
Given the reaction in markets it seems the expectation is for Powell to further hint towards cuts starting in September without an emergency-like drive behind them, as many had come to expect after the NFP report earlier this month.
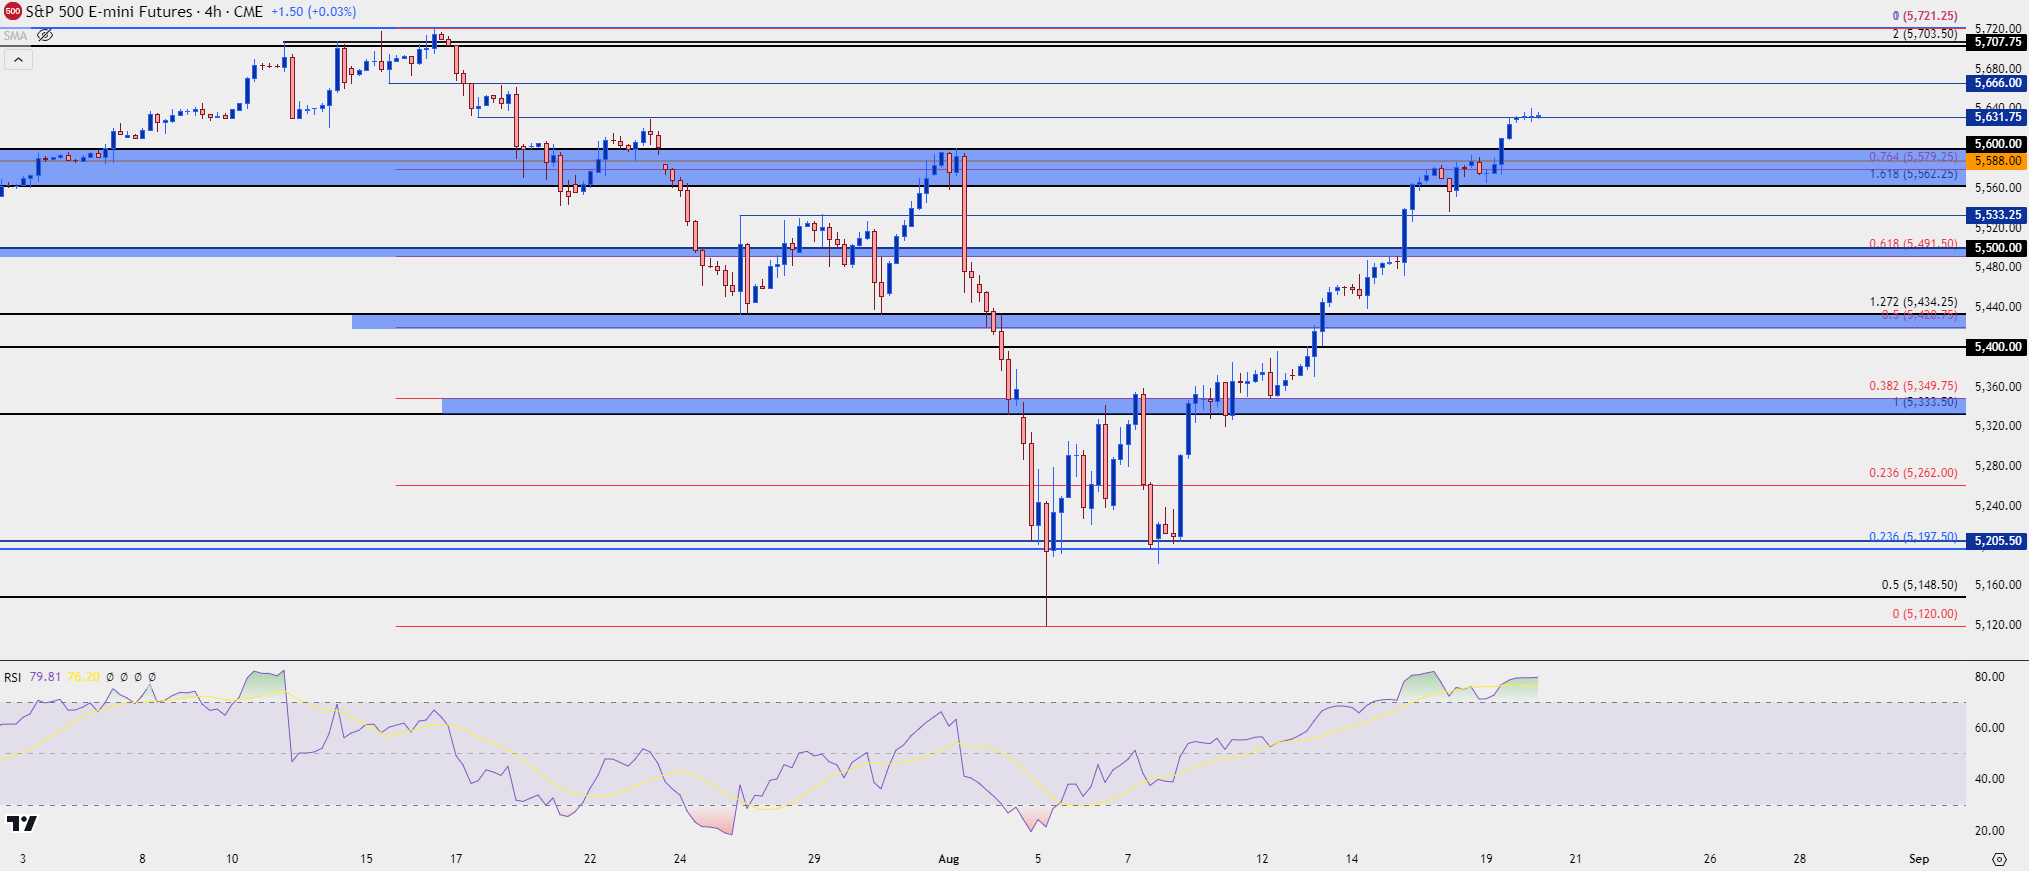
At this point the concern would be chasing a near-term overbought move as there’s already started to show a case of RSI divergence on the four-hour chart. That doesn’t necessarily denote bearish reversals, however, as this is merely sign of an aggressive bullish trend.
For resistance overhead, the same 5,666 level looked at yesterday remains of note, with the 5,700 area representing key resistance. The index struggled there for about a week after the BoJ intervention in July and ultimately sellers prevailed; so this would remain a key point of emphasis for bullish continuation scenarios. The ATH is at 5,721, to be exact.
For support, there’s quite a bit of structure given how quickly the bullish move has priced back-in. The prior resistance zone from 5,562-5,600 is notable, with levels at 5580 and 5588 showing in that area. Below that, I’m tracking 5533.25 and then the 5,500 zone, which I’m spanning down to the Fibonacci level at 5,491.50. That would be the area that buyers would need to hold to retain control and if they can’t, the door will begin to open to broader bearish reversal scenarios.
Resistance:
R1: 5,666
R2: 5,703.50
R3: 5,721.25
Support:
S1: 5,600
S2: 5,562.25
S3: 5,533.25
S4: 5,600
S&P 500 Futures Four-Hour Price Chart
 Chart prepared by James Stanley; data derived from Tradingview
--- written by James Stanley, Senior Strategist


