S&P 500 Talking Points:
- It’s been a strong rally over the last two weeks with S&P 500 Futures adding as much as 10.24% from the August 5th lows.
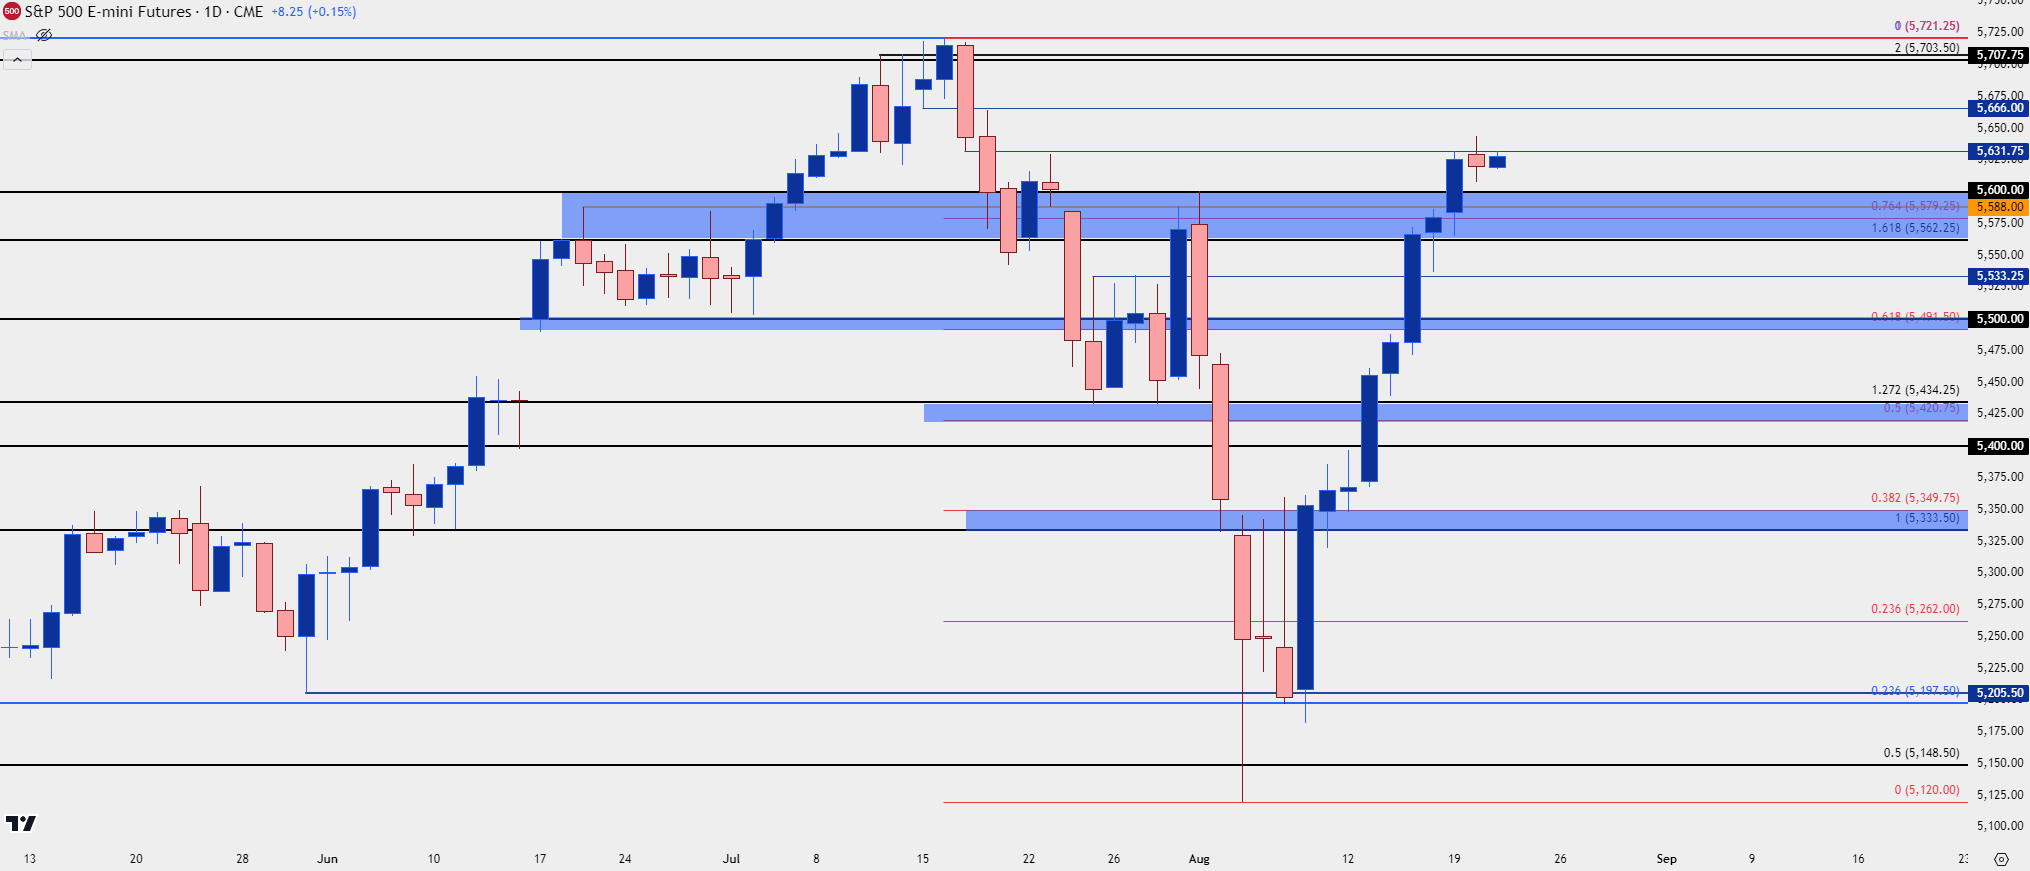
- ES came into yesterday with eight consecutive daily gains and that streak was snapped, with resistance at the 5631 level holding the highs and printing a spinning top on the daily chart.
- I’ll be looking into these setups in the Tuesday webinar and you’re welcome to join, click here for registration information.
S&P 500 Futures finally found some resistance that could hold for a bit. The 5631 level that I highlighted on Monday came into play later that day, and it was in the picture through much of yesterday as it helped to hold the daily high while producing a spinning top formation. Such candlesticks are often looked at like a doji, with an illustration of indecision.
That price is already back in-play this morning helping to hold the overnight high. And at this point, there’s a wide build of support structure below current prices after the prior eight-day rally drove as much as 10.24% into the index.
S&P 500 Futures – Daily Chart
 Chart prepared by James Stanley; data derived from Tradingview
S&P 500
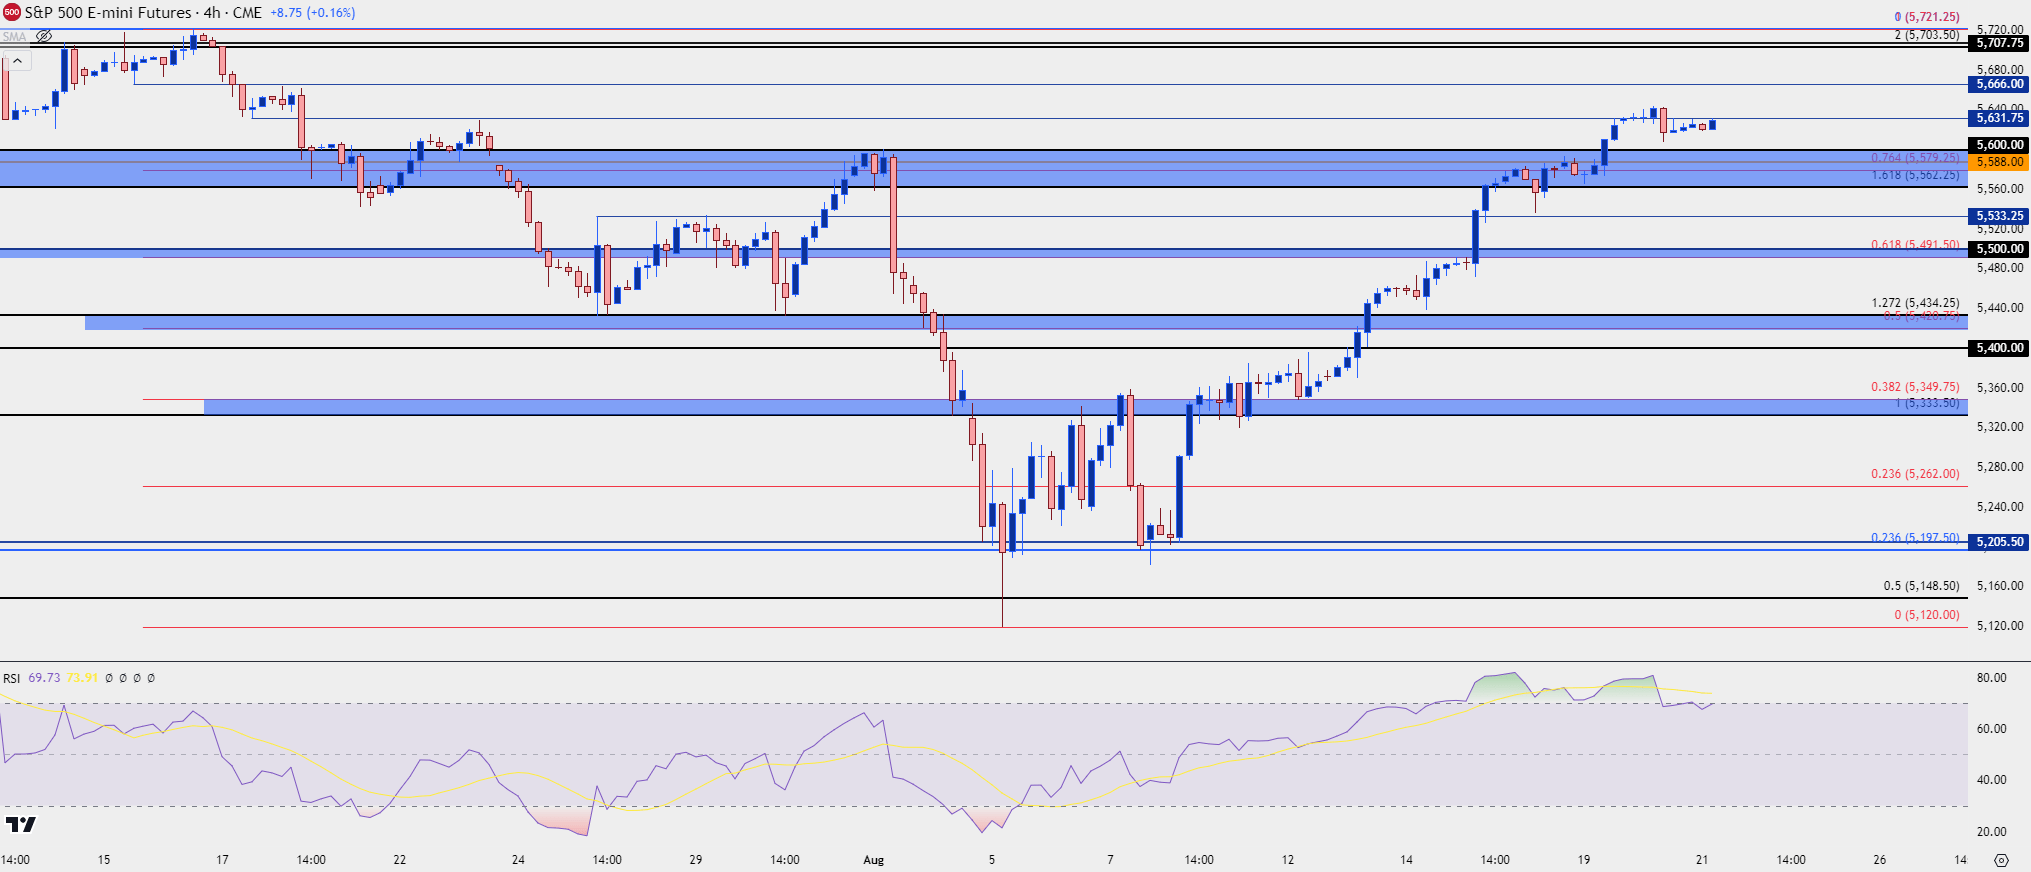
At this point the challenge on a short-term basis is just how overbought the move has become. RSI from the four-hour chart has been showing divergence and that indicator has just pushed back-below the 70-level. But with that said, sellers so far haven’t been able to make much of a dent in the trend since Thursday, August 8th as a series of strong U.S. data points have helped to pull risk markets back from the ledge, following the massive spike in VIX seen in early-August.
At this point, pullbacks can remain attractive for bulls and there’s a major zone nearby, with levels at 5562.25, 5579.25, 5588 and the psychological level at 5600. This would be the support zone that bulls would need to defend to retain control; but if they lose that, 5533.25 comes into the picture and that could open the door to a deeper pullback scenario. At that point, the current support zone could come into play as lower-high resistance in that broader sell-off scenario. And below that is another key zone, spanning from 5491.50 up to 5500.
Above current price, it’s largely the same structure looked at yesterday with 5566 ahead of the mass of resistance around 5700. The psychological level at 5700 is followed by 5703.50 and then 5721.25, which currently marks the all-time-high for the index.
Support:
S1: 5600
S2: 5562.25
S3: 5533.25
Resistance:
R1: 5666
R2: 5700
R3: 5721.25
S&P 500 Four-Hour Price Chart
 Chart prepared by James Stanley; data derived from Tradingview
--- written by James Stanley, Senior Strategist


