S&P 500, Nasdaq Talking Points:
- US equities came into the day with a full head of steam, extending the Fed-fueled rally from support the day before.
- Strength even remained for the first half-hour of the US equity session, but an aggressive reversal took over shortly after and this erased much of the gain from the day before.
- Non-farm Payrolls is on the docket for tomorrow and after the FOMC meeting, the unemployment rate is perhaps an even more important variable as the bank is watching for signs of weakness in the labor market in their equation for rate cuts.
- If you’d like to learn more about trading, I created the Trader’s Course, with six sections and more than seven hours of content. The first three installments are completely open and available: To learn more, the following link will explain further - The Trader’s Course
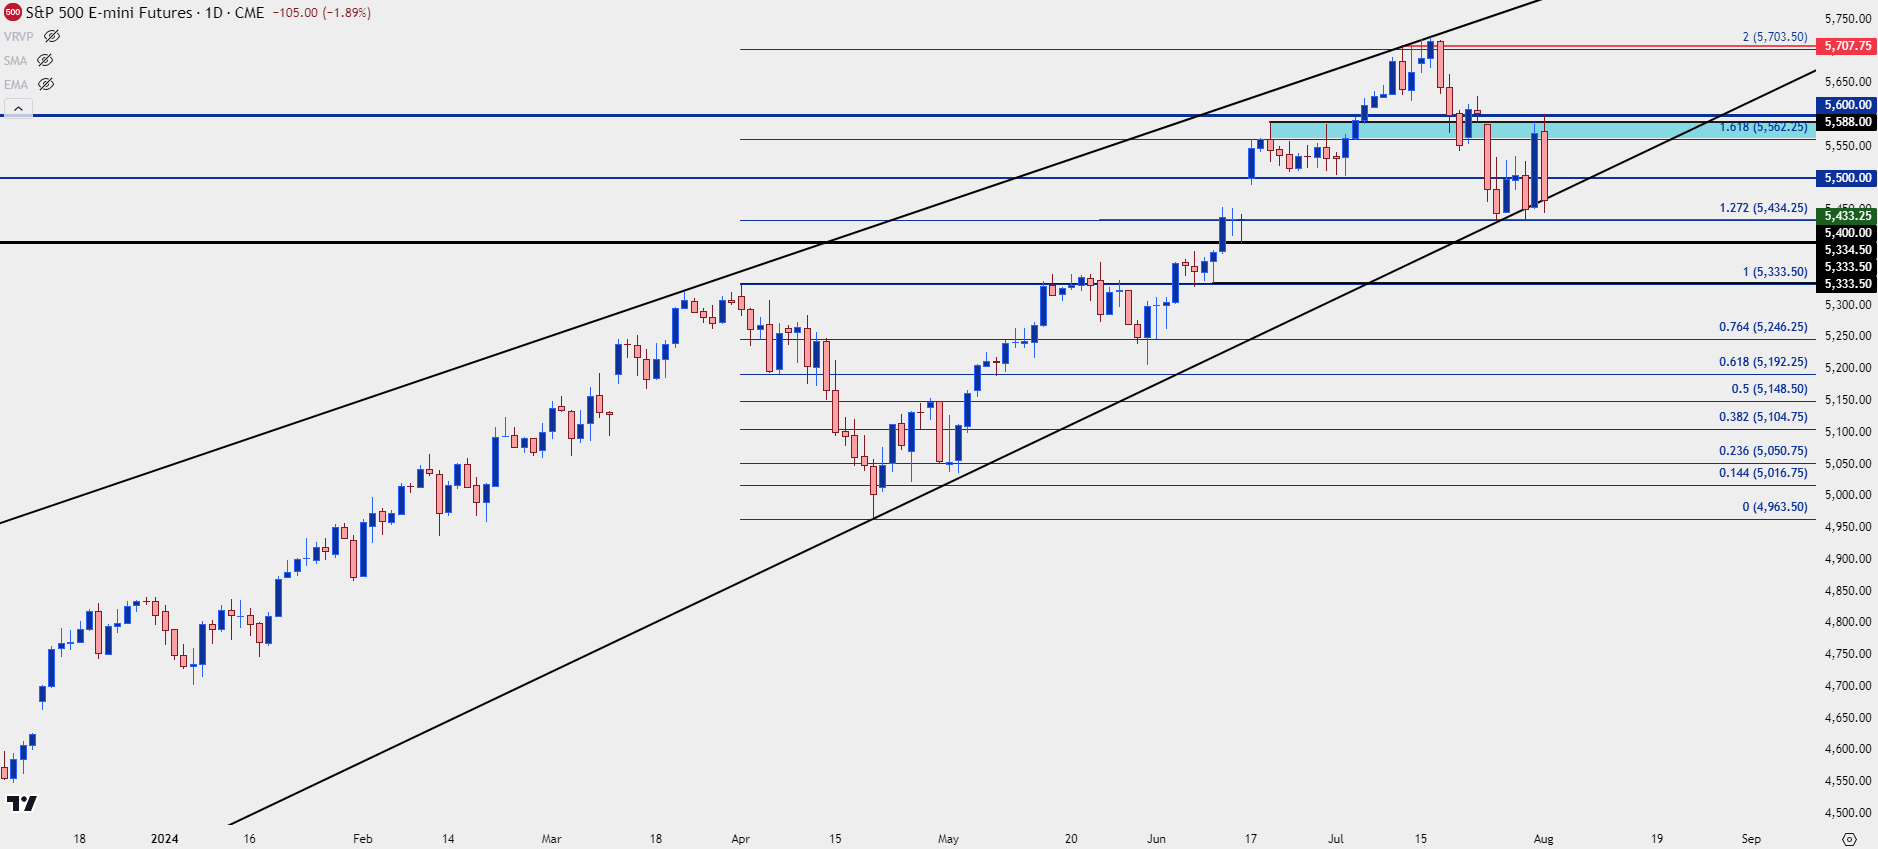
Equity bulls lost the handle today as both the S&P 500 and Nasdaq 100 saw aggressive reversals. In S&P 500 Futures, it was the 5,600 level that marked the highs and that traded briefly before the release of Manufacturing PMIs. While that data came out weaker-than-expected, the response is probably heavier than most would’ve thought.
At this point, S&P 500 Futures retain some of the support structure from earlier in the week with two inflections at the 5,433 level and perhaps one of the brightest spots for bulls is the fact that the level wasn’t re-tested again today.
That said, there is context for a broader bearish move as price continues to test the underside of a rising wedge formation. But – bears haven’t been able to punch through that yet, so this adds a bit of drama to tomorrow’s economic calendar.
S&P 500 Futures – Daily Chart
 Chart prepared by James Stanley; data derived from Tradingview
S&P 500 Shorter-Term
Such as we’ve seen already this week, sentiment can turn on a dime; and the importance of tomorrow’s NFP report cannot be understated. The unemployment rate has been a particularly strong piece of data pushing for rate cuts as it’s printed above-expectation for the past three months, climbing from 3.9% to 4.0% to last month’s 4.1%. If this comes out at a 4.2% or higher tomorrow, there could be even greater confidence in a September rate cut which could give bulls reason to cheer.
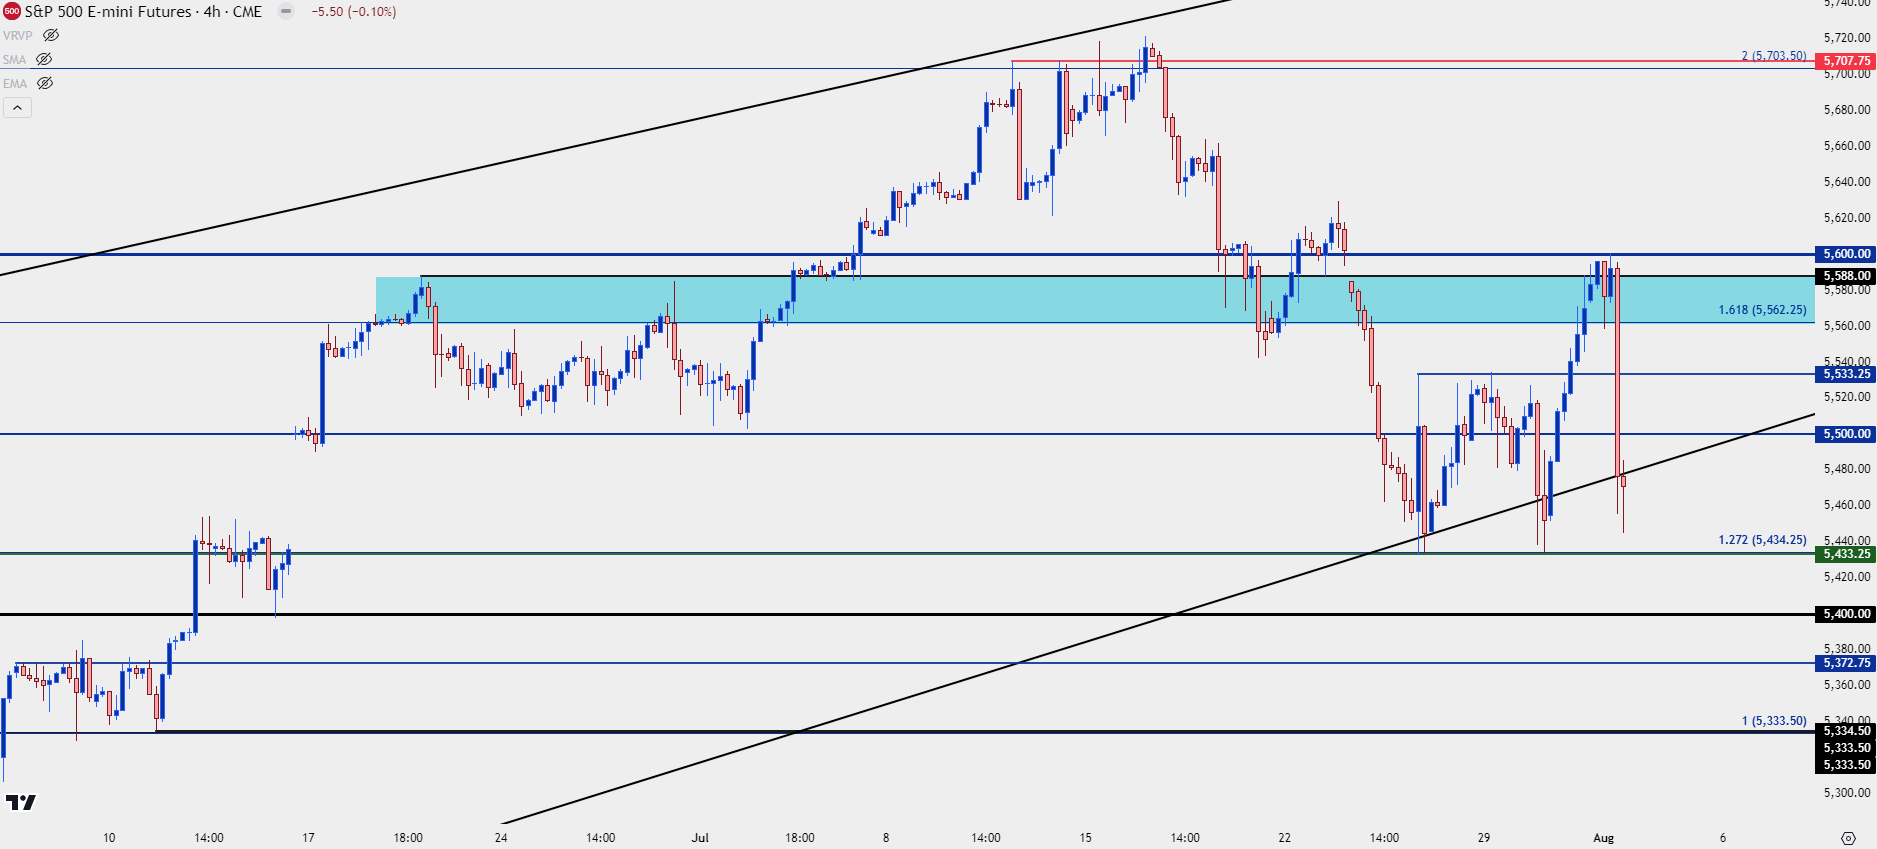
At this point, the fact that sellers did not push down to a fresh low today is of interest, as there was a very clear spot of support that was open for re-test. After-hour earnings from Apple have helped to soften the underside wick on the daily and four-hour bars, setting the stage for tomorrow’s NFP.
For levels: 5433 is a key price to hold into the weekly close. Below that, I’m tracking the psychological level of 5,400 and then a prior spot of resistance at 5,372 followed by the prior swing-high at 5,333.
Above current price, 5,500 remains key, followed by 5,517 and 5,533. Above that, the same zone that held the highs after FOMC appears and this runs from 5,562 up to 5,588. The 5,600 level would be the spot that bulls need to take out to exhibit control.
S&P 500 Four-Hour Price Chart
 Chart prepared by James Stanley; data derived from Tradingview
Nasdaq 100
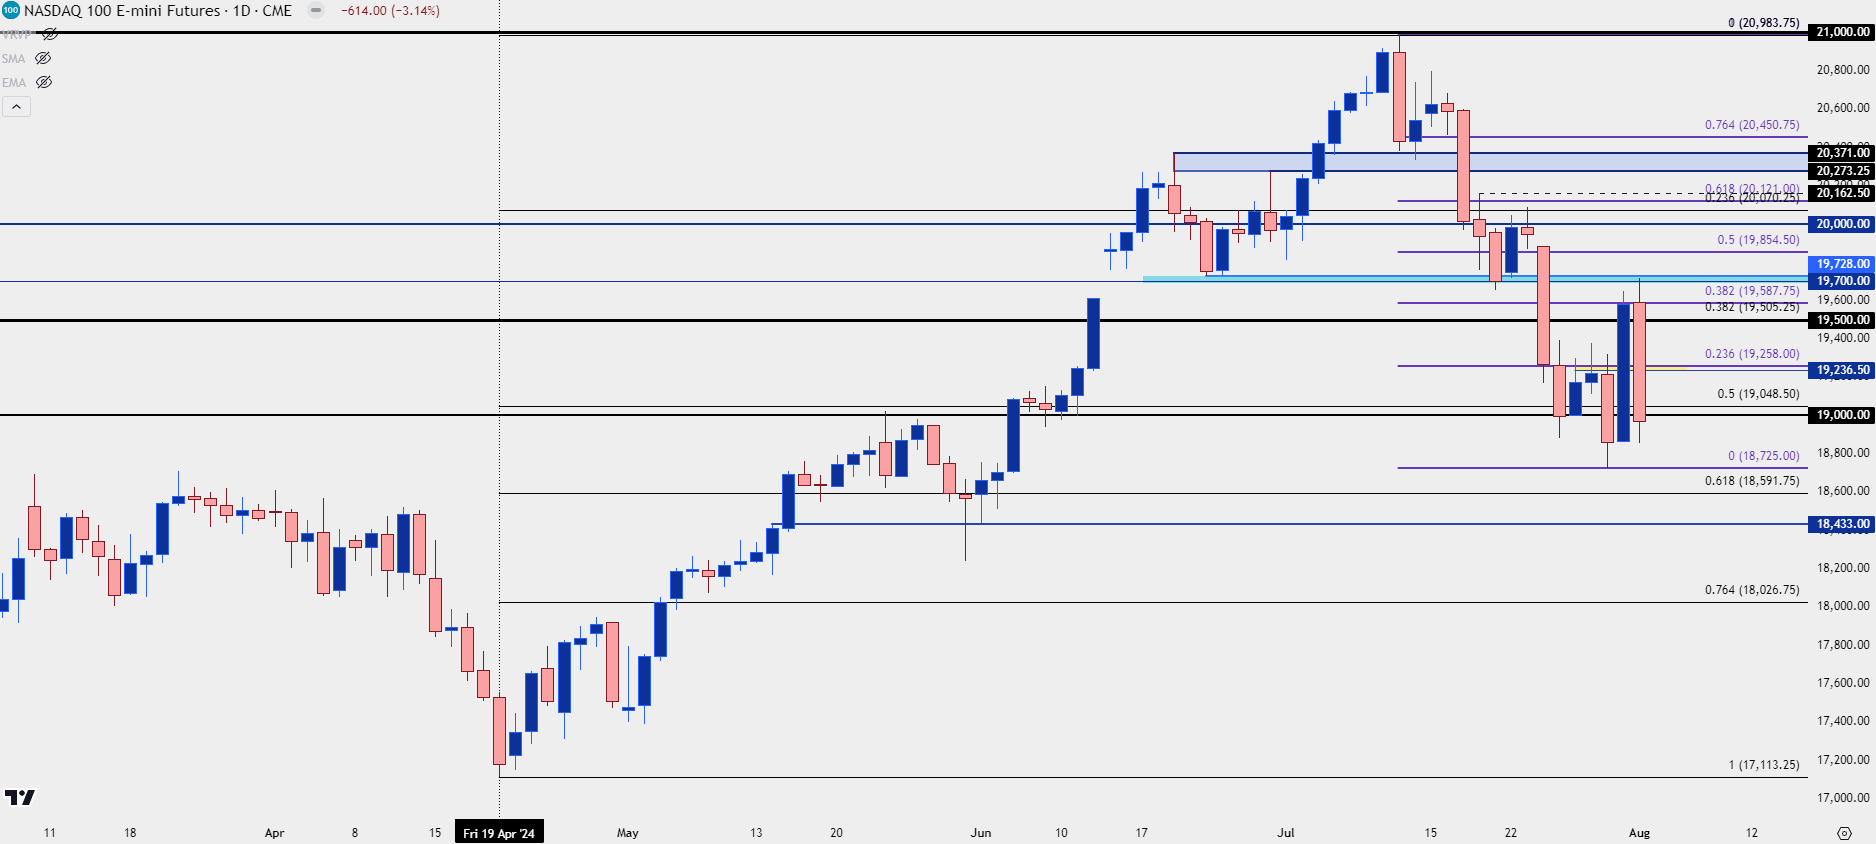
The Nasdaq experienced a similar reaction today but the resistance level in-play there was the same 19,700 zone that I had warned of yesterday. And while the sell-off was intense – seller stopped short of taking out the prior day’s low.
Nonetheless the patterning on the below daily chart is clear, following the bearish engulf on the daily from July 11th, which marks the top of trend. The 18,725 level remains key and if sellers can push below that, the door opens to re-test potential of the 61.8% retracement of the recent bullish trend, plotted at 18,591. Below that, I’m tracking 18,435 and that’s followed by a confluent spot, spanning from 18k-18,026.
On the upside, the 19k level remains important, followed by the zone from 19,236-19,258. Above that is the 19,500 level and then the 19,700 zone that helped to catch the high today.
Nasdaq 100 Daily Price Chart
 Chart prepared by James Stanley; data derived from Tradingview
--- written by James Stanley, Senior Strategist


