
S&P 500, Nasdaq Talking Points:
- Stocks have been on a rocky road since the US CPI report on July 11th and indices limped into this week grasping on to support.
- The FOMC rate decision later today is expected to bring no policy changes, but with expectations showing a 100% probability for at least one cut by the end of September, today becomes an important meeting for the Fed and Powell to set the stage for a cut at their next meeting.
- If you’re looking to incorporate fundamental analysis with technical, the Trader’s Course has a plethora of information that can help. To learn more: The Trader’s Course
Fed day is here and we’re near the point where the rubber meets the road. While the FOMC starting cuts in 2024 has long been expected, there’s only three more meetings after today and markets are still looking for three full 25 basis point cuts. Deductively, that means that the Fed would probably want to start laying the groundwork for such at today’s rate decision and I think that’s what we’re going to hear from Jerome Powell later today.
It hasn’t been smooth sailing for stocks of late. Equities started to pullback a few weeks ago after another below-expected CPI report out of the US and after the reaction to Google earnings last week, there was growing fear of an AI-bubble popping. I talked about this last week and as I shared then, I don’t expect that to be the case at the moment as there’s still a few bullish items of note, including a generally dovish FOMC.
Expectations are high for the Fed to lean into rate cuts in their final three meetings of the year, surrounding the US election in November. And as of this writing, there’s a 100% probability of at least one cut by the end of the September meeting, and that would be a requirement to retain the expectation for cuts in November and December.
Rate Probabilities for September FOMC
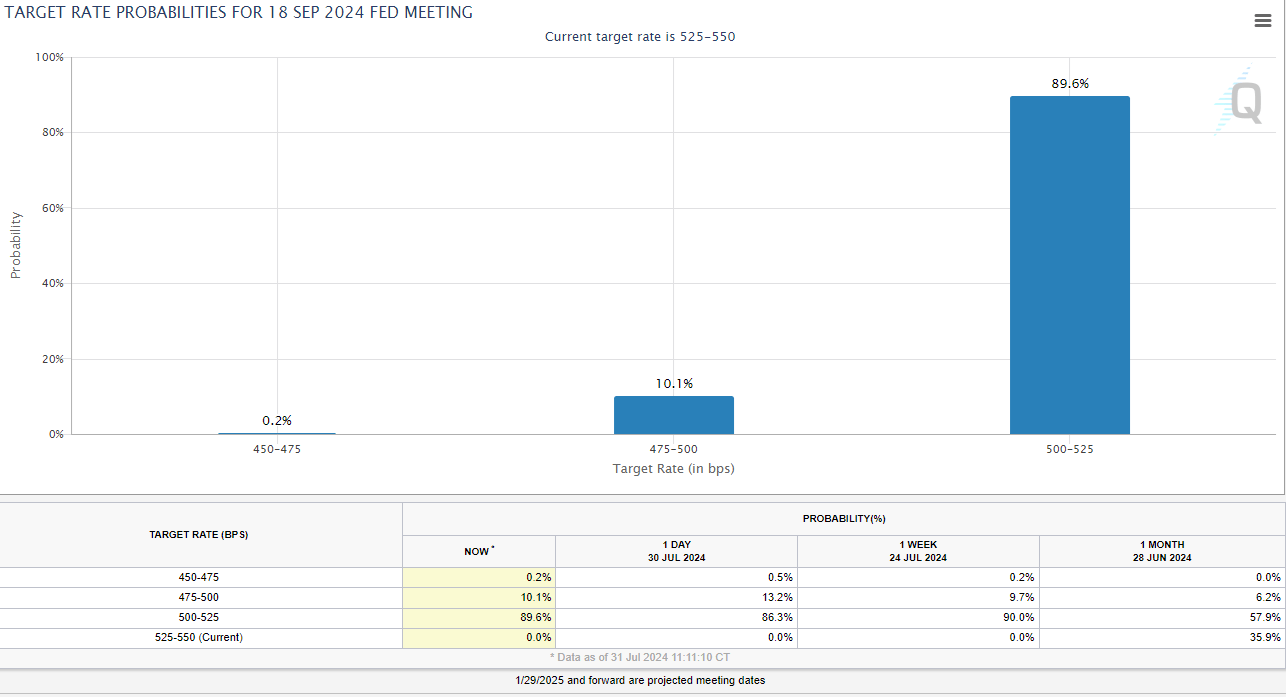 Chart prepared by James Stanley; data derived from CME Fedwatch
S&P 500
The S&P 500 has so far held a key spot of support on another test so far this week, the same that I highlighted last Friday. That plots at 5435, which is both an Fibonacci extension of the Q2 pullback and a prior swing high.
That price came into play again last night after the release of Microsoft and AMD earnings and, again, it held the lows. Buyers have since rushed back in to push a breakout and a fresh weekly high as we move towards FOMC.
Also of importance for that support – it’s the underside of a rising wedge pattern and those are often followed with aim of bearish reversal; but a downside break is required to trigger the formation and that’s what bulls escaped last night with the support hold.
S&P 500 Weekly Price Chart
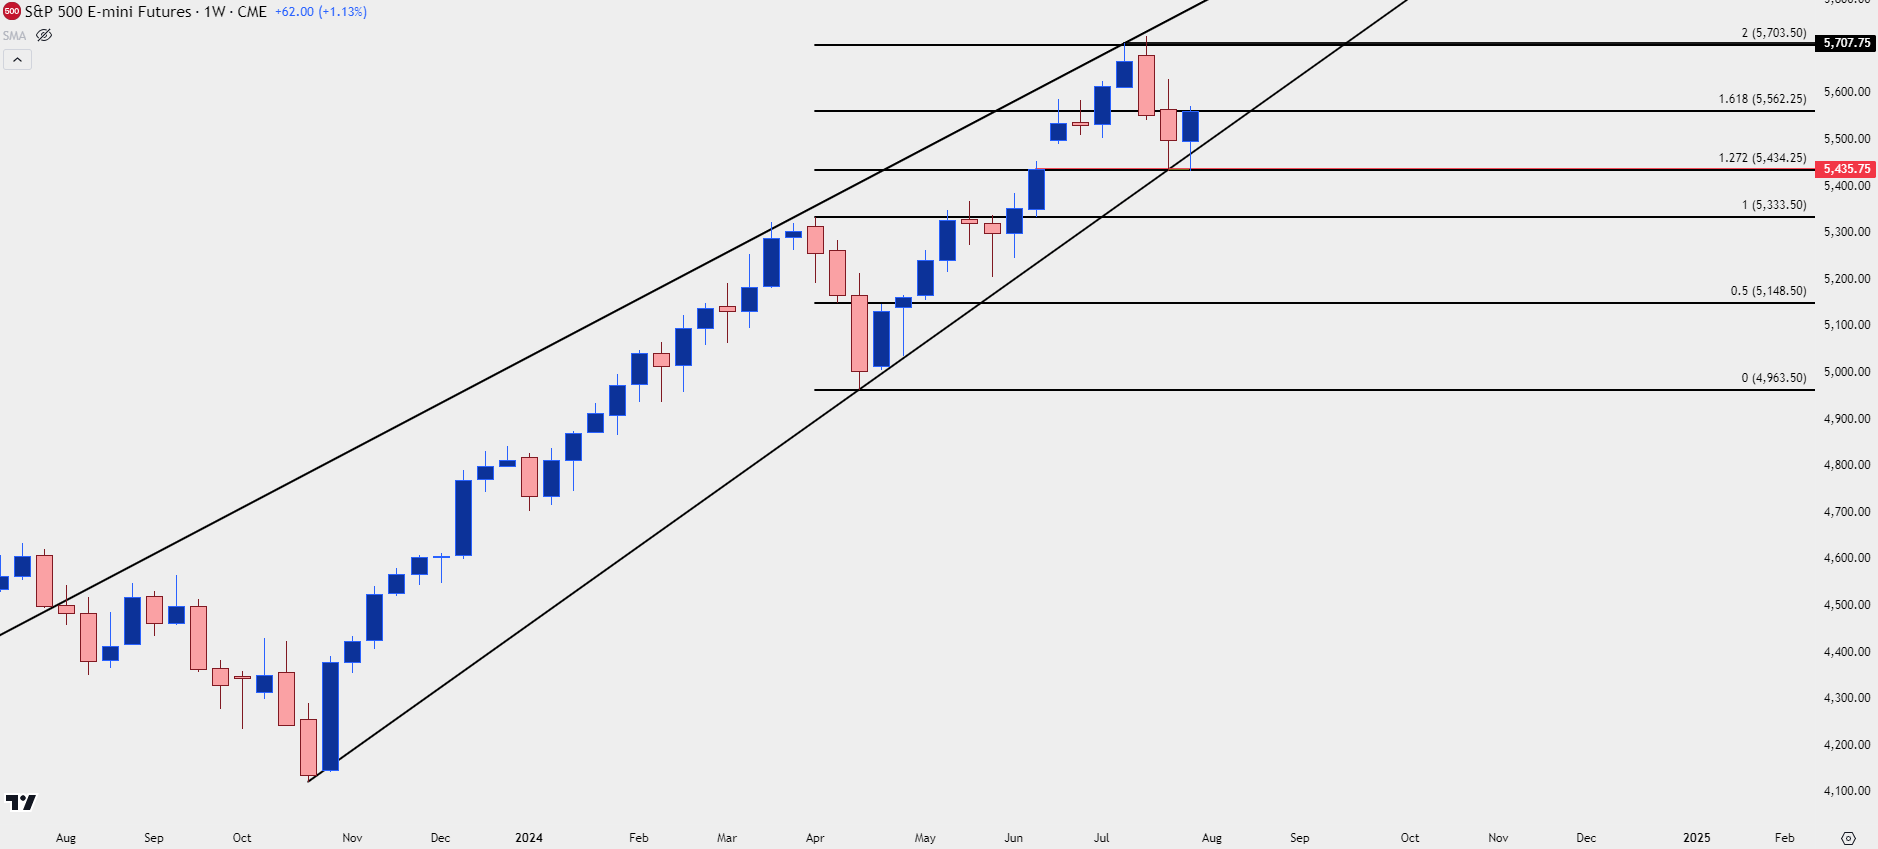 Chart prepared by James Stanley; data derived from Tradingview
S&P 500 Shorter-Term
On a shorter-term basis, that bounce from support has provided some bullish structure that buyers can defend if they want to retain control of the trend. There were two tests of resistance at 5533 and that now becomes support potential. Below that, 5517 remains of note, as does the psychological level of 5,500
Reasonably, any higher-low above yesterday’s inflection could keep the door open for buyers and there’s quite a bit of space between 5435 and the 5500 psychological level.
S&P 500 Four-Hour Price Chart
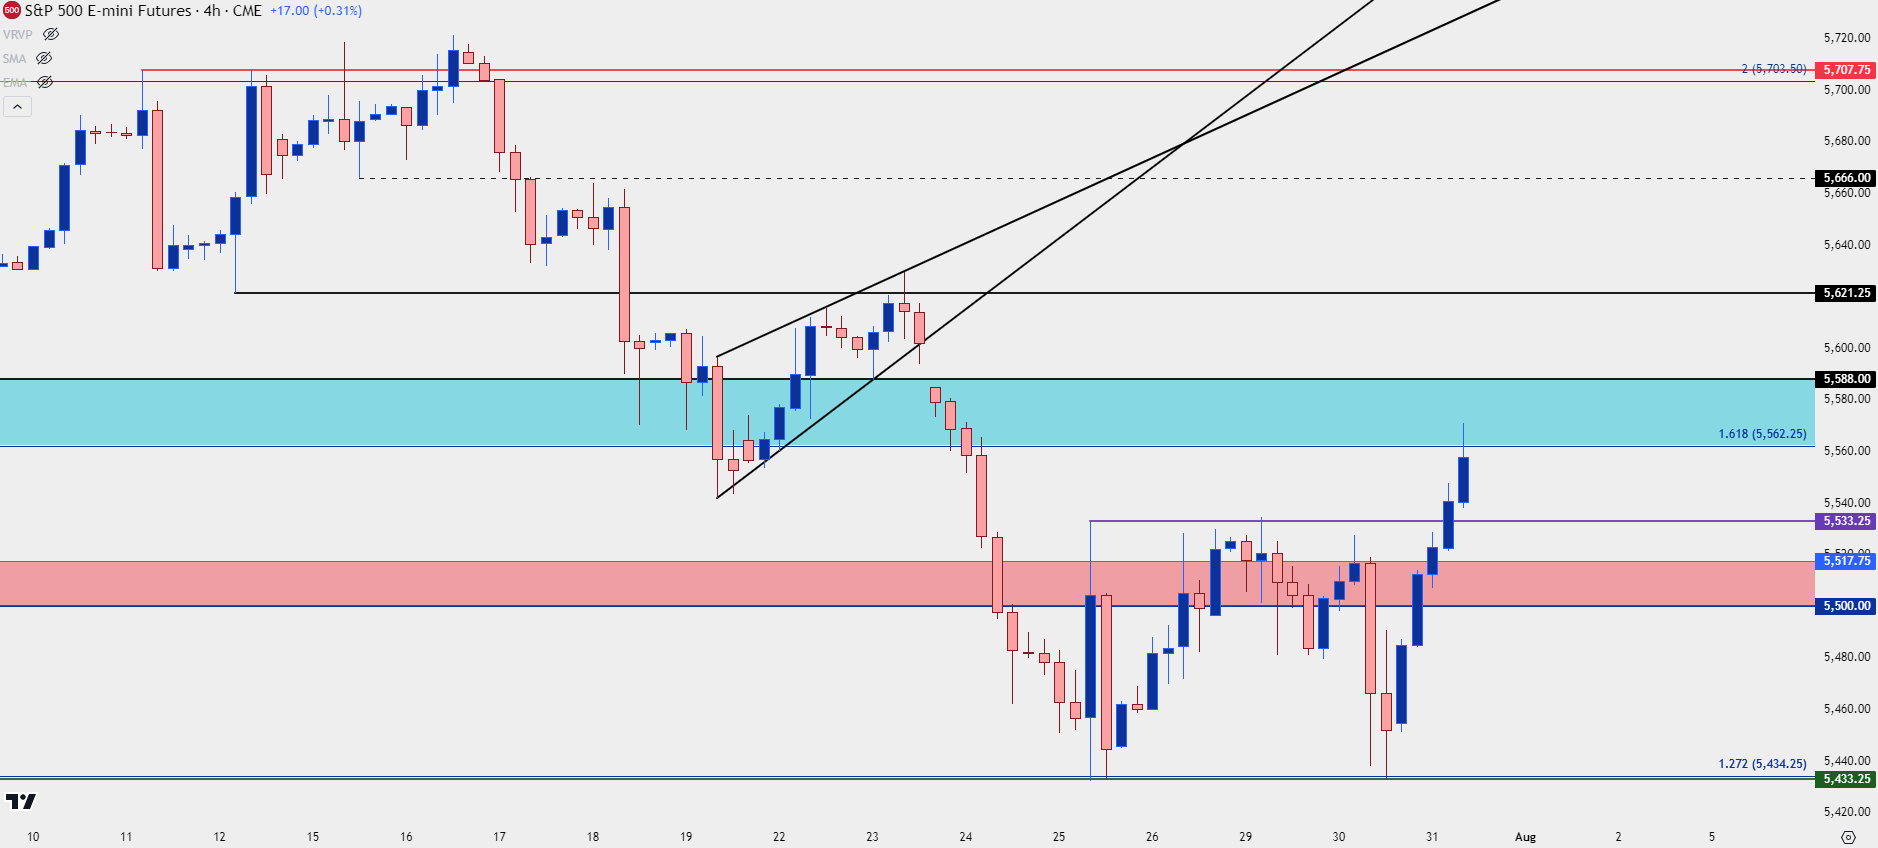 Chart prepared by James Stanley; data derived from Tradingview
Nasdaq 100
Given the punch to the AI-theme, the Nasdaq pullback felt a bit heavier than what showed in the S&P 500. But, similarly, there’s been a strong rally since yesterday’s lows came into play after the release of Microsoft and AMD earnings.
But, notably, there’s earnings reports from Meta after the bell today and Apple and Amazon tomorrow, so matters can change quickly.
The sell-off in Nasdaq 100 futures has been very clear since the bearish engulf that printed on the day of US CPI earlier in July and sellers pushed down for a fresh monthly low yesterday. The bounce since, however, has been fairly loud and price is already re-testing resistance at 19,500.
Nasdaq 100 Futures – Daily Price Chart
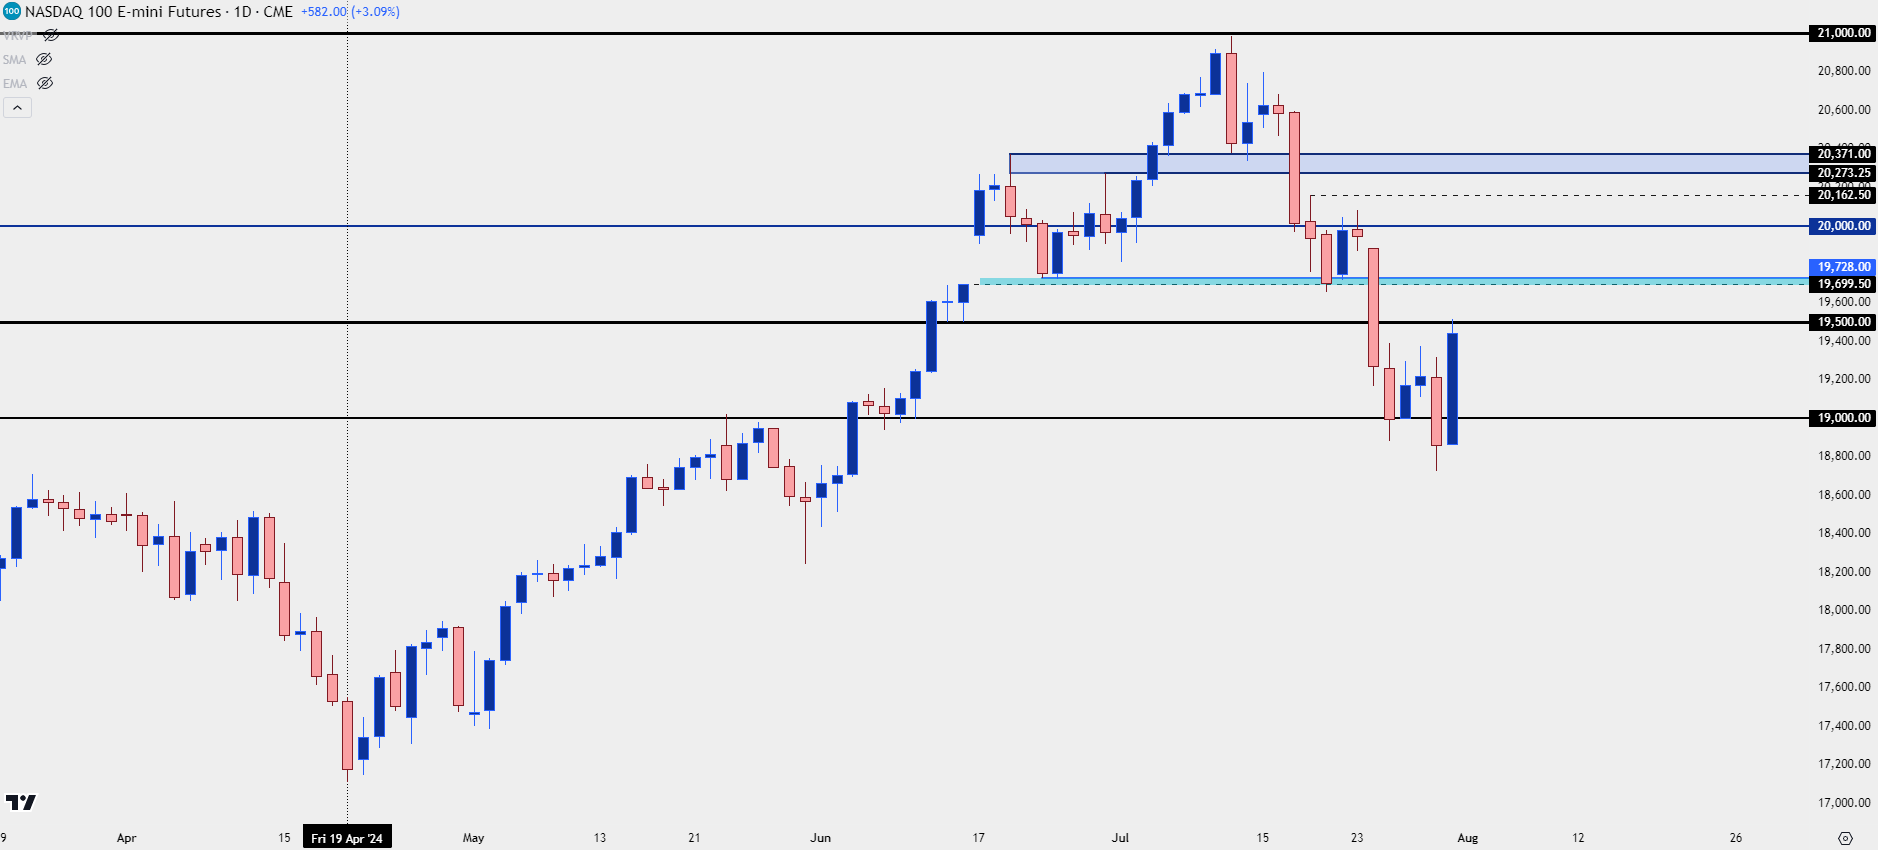 Chart prepared by James Stanley; data derived from Tradingview
Nasdaq Shorter-Term
From the four-hour chart we can see that 19,500 resistance test showing as a near-term higher-high, and that opens the door for bulls if they can hold a higher-low. Given how volatile this has been over the past 24 hours there’s a few different swings of note that could produce that higher-low, showing at 19,367, 19,236 and then 19,104. Even the 19k level could be re-purposed as higher-low support but that appears to be the major spot that bulls would need to defend to retain control of the shorter-term move.
Nasdaq 100 Four-Hour Price Chart
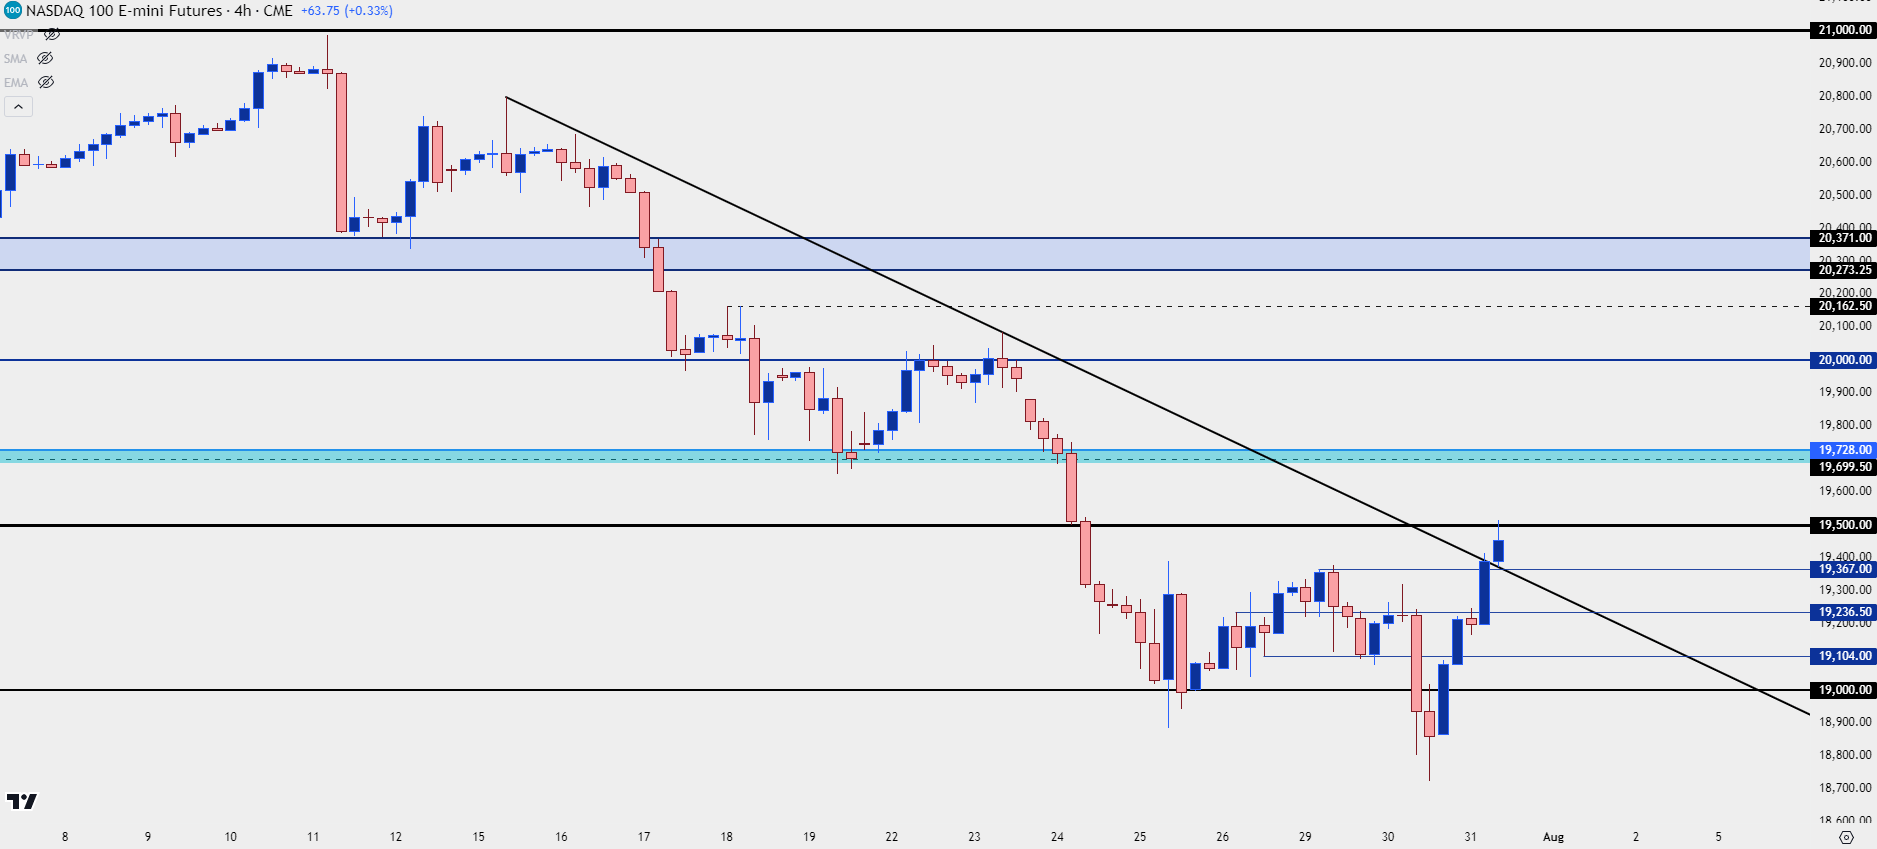 Chart prepared by James Stanley; data derived from Tradingview
--- written by James Stanley, Senior Strategist


