
S&P 500, Nasdaq Talking Points:
- U.S. Equities have taken a hit over the past few weeks and last week saw capital flowing from equities and into bonds as market participants try to get in-front of rate cuts from the Fed.
- While pricing in rate cuts can be bullish for equities, actual rate cuts can present a different story, as falling yields come with higher bond prices and that can become an attractive trade in a falling rate backdrop.
- If want to learn more about technical or fundamental analysis, along with trading strategy, The Trader’s Course can help: Click here to learn more.
It was a bad week for stocks, there’s no other way to put it. While the Fed laid the groundwork for rate cuts to begin at the September meeting, markets showed a brutal reaction after that meeting as capital flowed into Treasuries in anticipation of those cuts. At this point, both the two and ten year Treasury are showing yields below 4%, and considering how much capital flows through those markets, that takes a massive lift from market participants.
And that capital came from many other places, stocks included, as the AI-trade continued to pull back on fears that revenues won’t be able to justify the stretched valuations.
I looked into the broader backdrop a little earlier today, and in this article I’m going to get into a bit more depth behind US equities and current technical structures. Before I do that, I need to set the stage with a look at VIX.
VIX Spike
VIX is often called the ‘fear index,’ and it will tend to flare during sell-offs. But, given the complacency that had taken hold in stocks over the past year as markets were girding for rate cuts, VIX remained very calm while holding around the 12-handle. There was but one instance of VIX above 20 in 2024 trade, and that was right at the lows in Q2 after the pullback. VIX quickly sunk back below 20, equities began to rise and before you know it, we had a fresh all-time-high in the S&P 500.
On Friday after the NFP report, VIX made a massive push to nearly take out the 30-level. The last time VIX was this elevated was in March of 2023, around the time of the regional banking crisis. In that episode, the Fed was able to allay the pain by talking up rate hikes which, eventually, helped stocks to rally.
Given the built-in expectation already for the Fed to begin cutting rates, they don’t have that card in the back pocket. And now there’s the very viable question as to whether rate cuts will boost stocks because further falling rates can make Treasuries look quite attractive. Case in point, the TLT ETF representing Treasuries with 20+ years of maturity is working on its strongest week since March of 2020, just as the pandemic was getting priced-in.
And, traditionally, rate cut backdrops haven’t always been the best time to be on the long side of equities, although in full disclosure, rate cuts are often happening due to growth fears which begs the question of correlation verse causation.
VIX Daily Price Chart
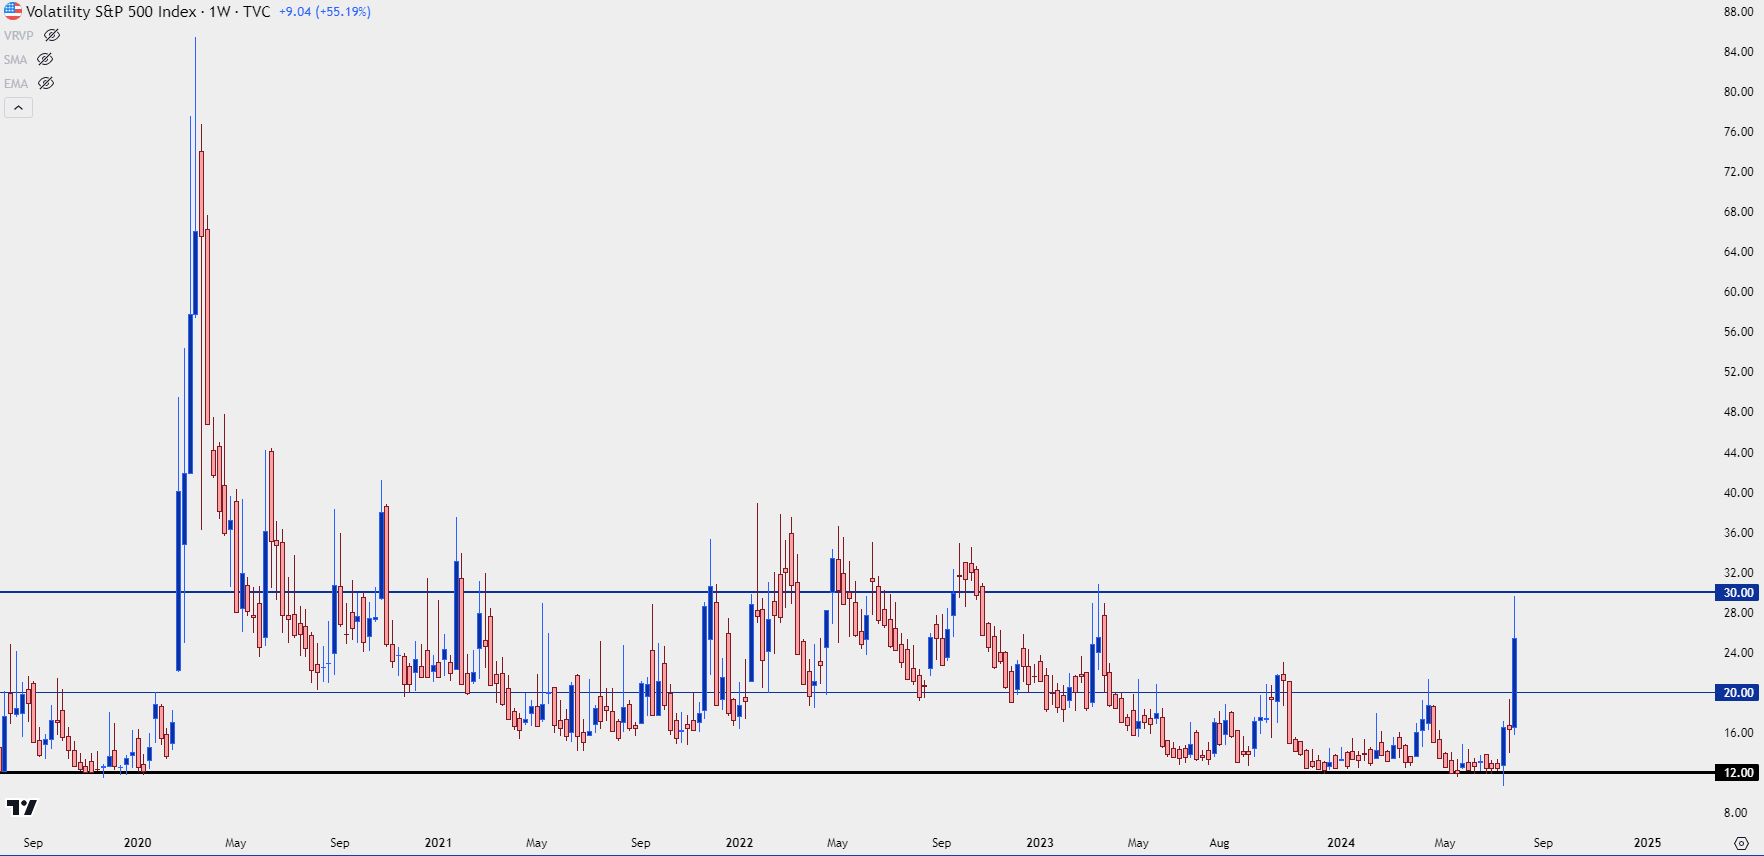 Chart prepared by James Stanley; data derived from Tradingview
S&P 500
It’s been a strong push in stocks, especially over the past nine months. S&P 500 Futures showed an incredibly consistent rally, with the only notable pullback after the Q2 open. That ended after the VIX test over 20 and bulls got back in the driver’s seat to push another fresh all-time-high.
But – the rally was uneven, with bulls showing more aggression at support or tests of lows than they did at resistance or tests of highs, leading to the build of a rising wedge pattern.
The pullback that began a couple of weeks ago saw price hold around the 5,700 level, and it didn’t take long for a pullback to develop to the support side of that wedge, which was confluent with another level of note as the 127.2% extension of the Q2 pullback. That held the low two weeks ago and then again last week ahead of the Fed. And as the FOMC sounded nice and dovish, stocks rallied for ES to re-test the 5,600 level.
But that’s when the proverbial music stopped and this time – the 5,434 level couldn’t stop the bleeding.
At this point support has shown at the prior swing high from the Q2 open at 5,334.
S&P 500 Futures – Daily Price Chart
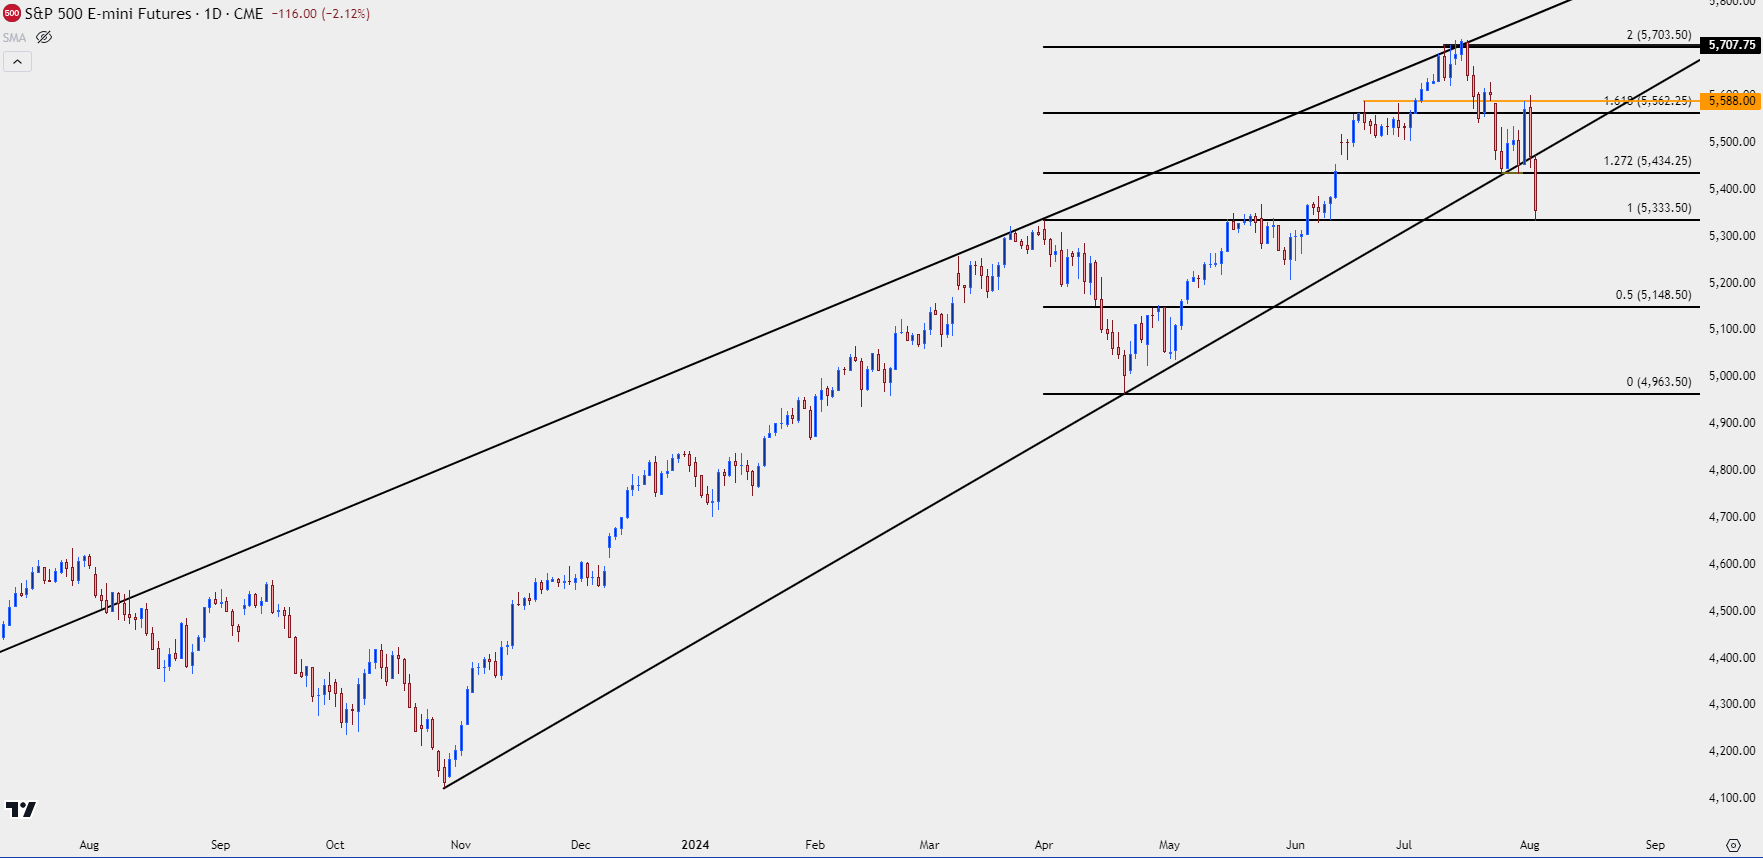 Chart prepared by James Stanley; data derived from Tradingview
S&P 500 Shorter-Term
If there’s one major takeaway from last week, it’s the danger of getting too bearish while at support or too bullish while at resistance.
As the old saying goes, ‘there’s nothing like price to change sentiment’ and many human beings will get bulled-up on strong markets and pessimistic on sour markets. It’s very human and normal, but it can also end badly as a trader could end up selling bottoms and buying tops, and that can be a painful way to go.
This isn’t to say that breakout strategies are impossible, but those approaches need to be coupled with bespoke money management so that if the break doesn’t take hold, risk can still be mitigated; whereas traders selling at support then need to look at stops on shorts above resistance. And for traders buying breakouts at resistance but setting stops all the way below support, the risk outlay can simply be too large to justify the reward potential of a breakout.
In S&P 500 Futures, there were two rallies building from the 5,434 level and as the Fed finished on Wednesday, a strong bid had taken-over as S&P 500 futures flickered up to 5,600.
So far, there’s been a show of support at the prior swing high of 5,334, and prior support is now potential resistance, with that 5434 level particularly clear as that showed two different bounces before the break of the wedge pattern.
S&P 500 Four-Hour Price Chart
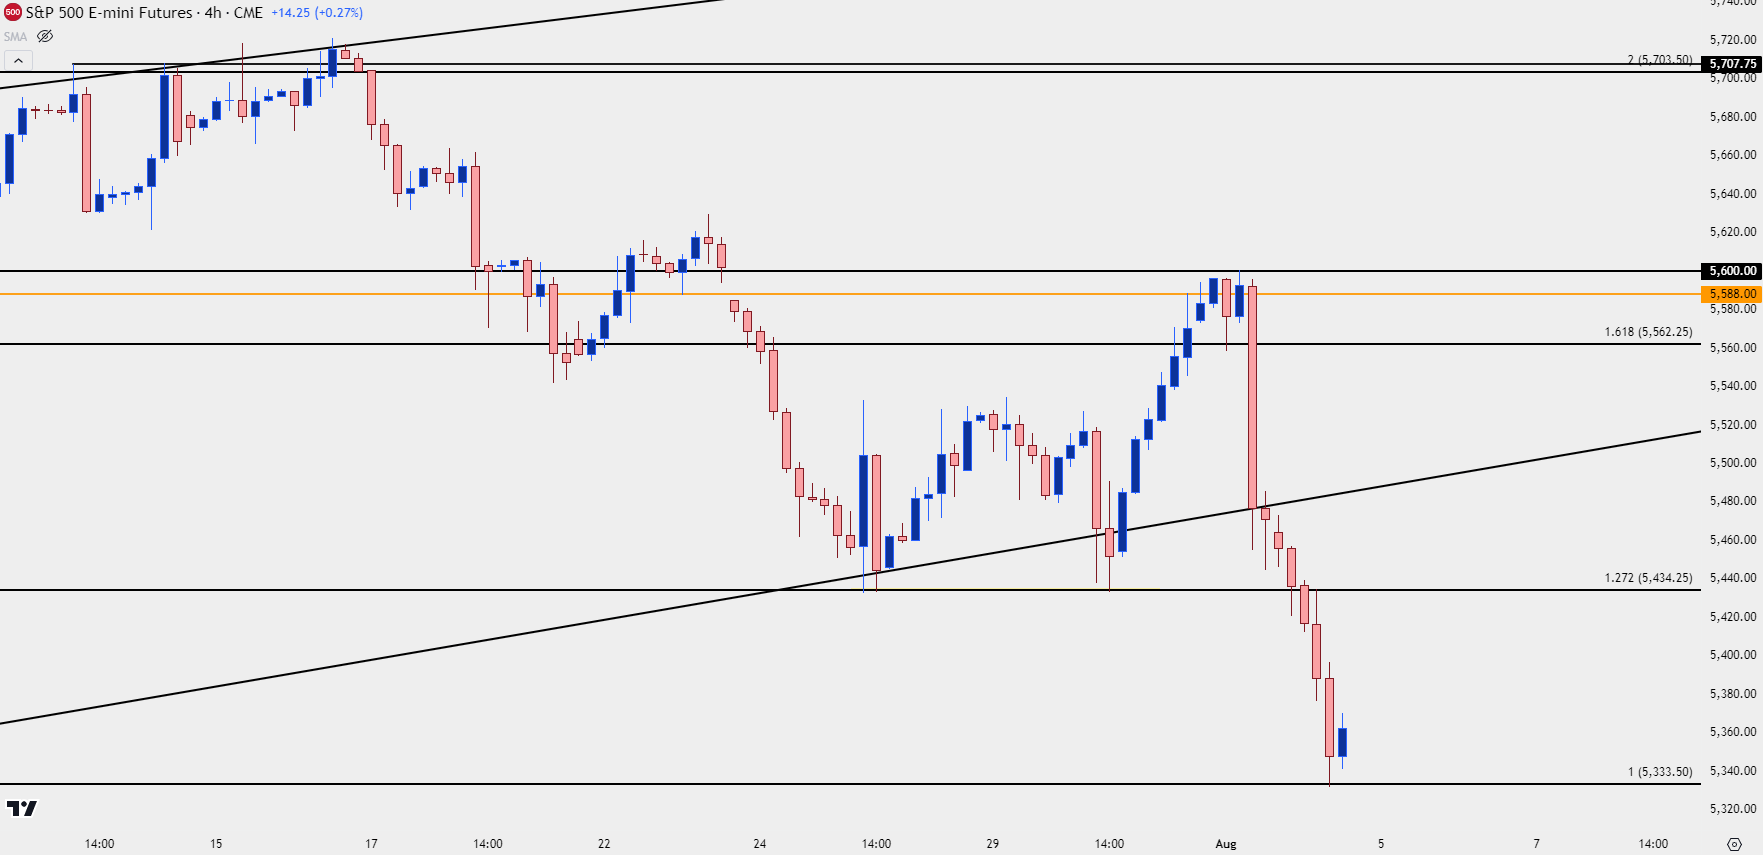 Chart prepared by James Stanley; data derived from Tradingview
Nasdaq 100
Given the heavier allocation of technology and AI-driven equities, the Nasdaq has been hit even harder than the S&P 500 above. But, to put the move into scope we can look at the weekly chart to notice that we’ve seen a clean 23.6% Fibonacci retracement of the AI-rally.
Nasdaq 100 Weekly Price Chart
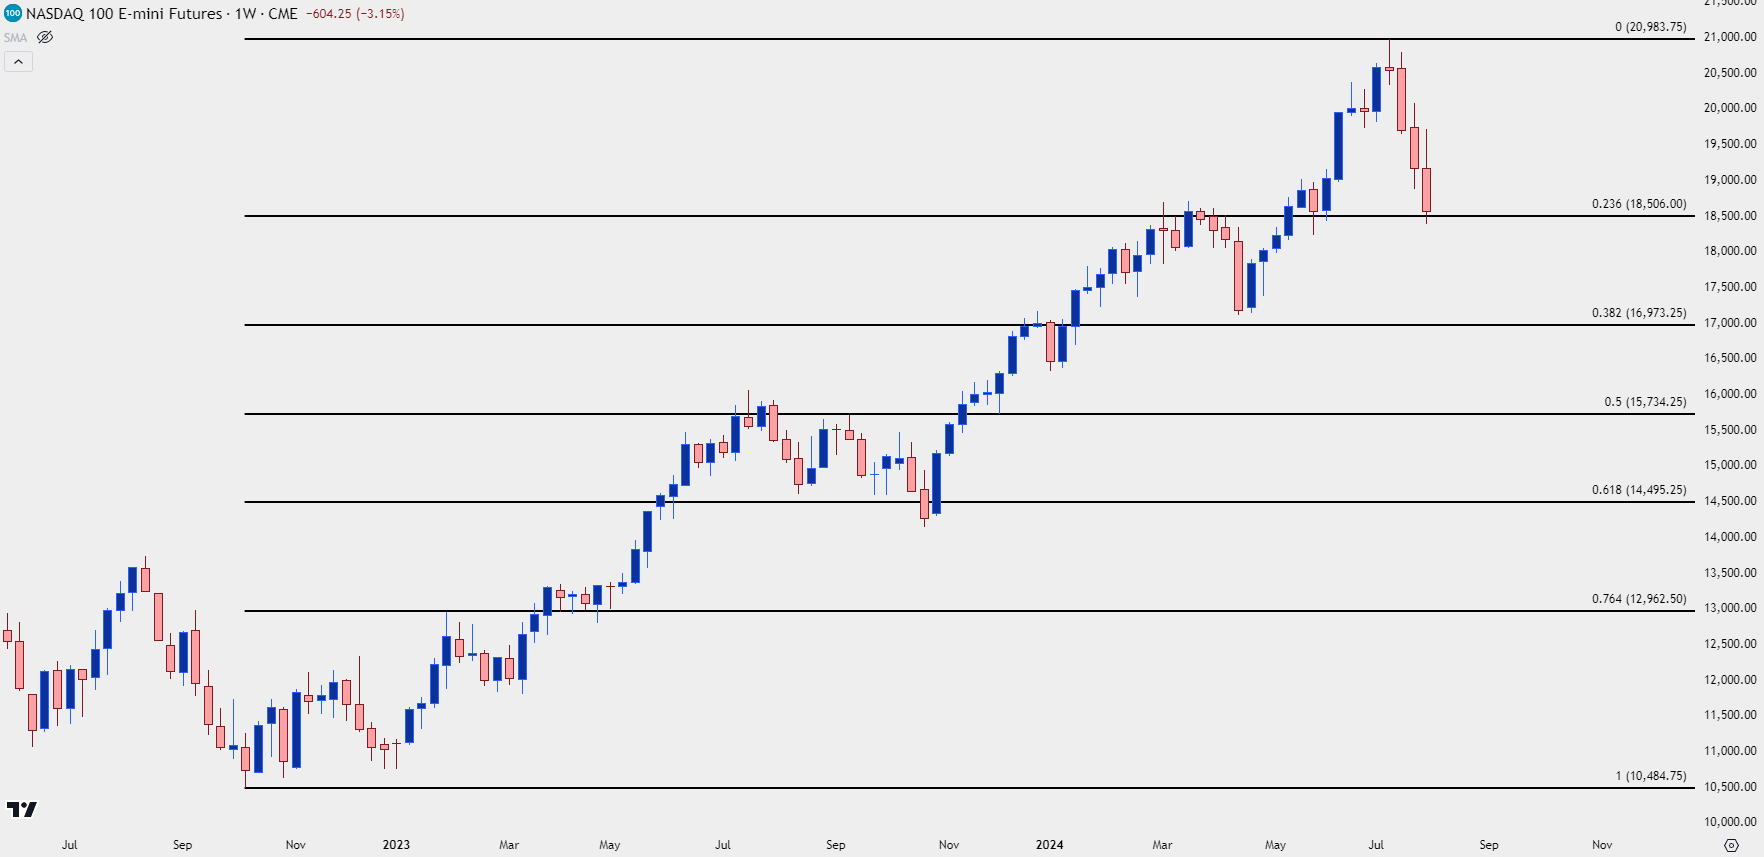 Chart prepared by James Stanley; data derived from Tradingview
Nasdaq Shorter-Term: Close to but not quite oversold
This theme was in full view after the Q2 open when equities were pulling back. There were just a few weeks of pain but, quickly, RSI dipped into oversold territory and that helped to mark the low for the index. That’s not to say that we’ll see that play out perfectly but it is notable that we haven’t yet seen RSI push into oversold on the daily and this highlights the fact that the sell-off may not yet be over.
From a structural perspective, we’re seeing a current test of support at prior resistance. Below current price, there’s another prior swing level at 18,266 and below that, a zone around the 18k level that had functioned as resistance during the recovery push back in April.
Nasdaq 100 Daily Price Chart
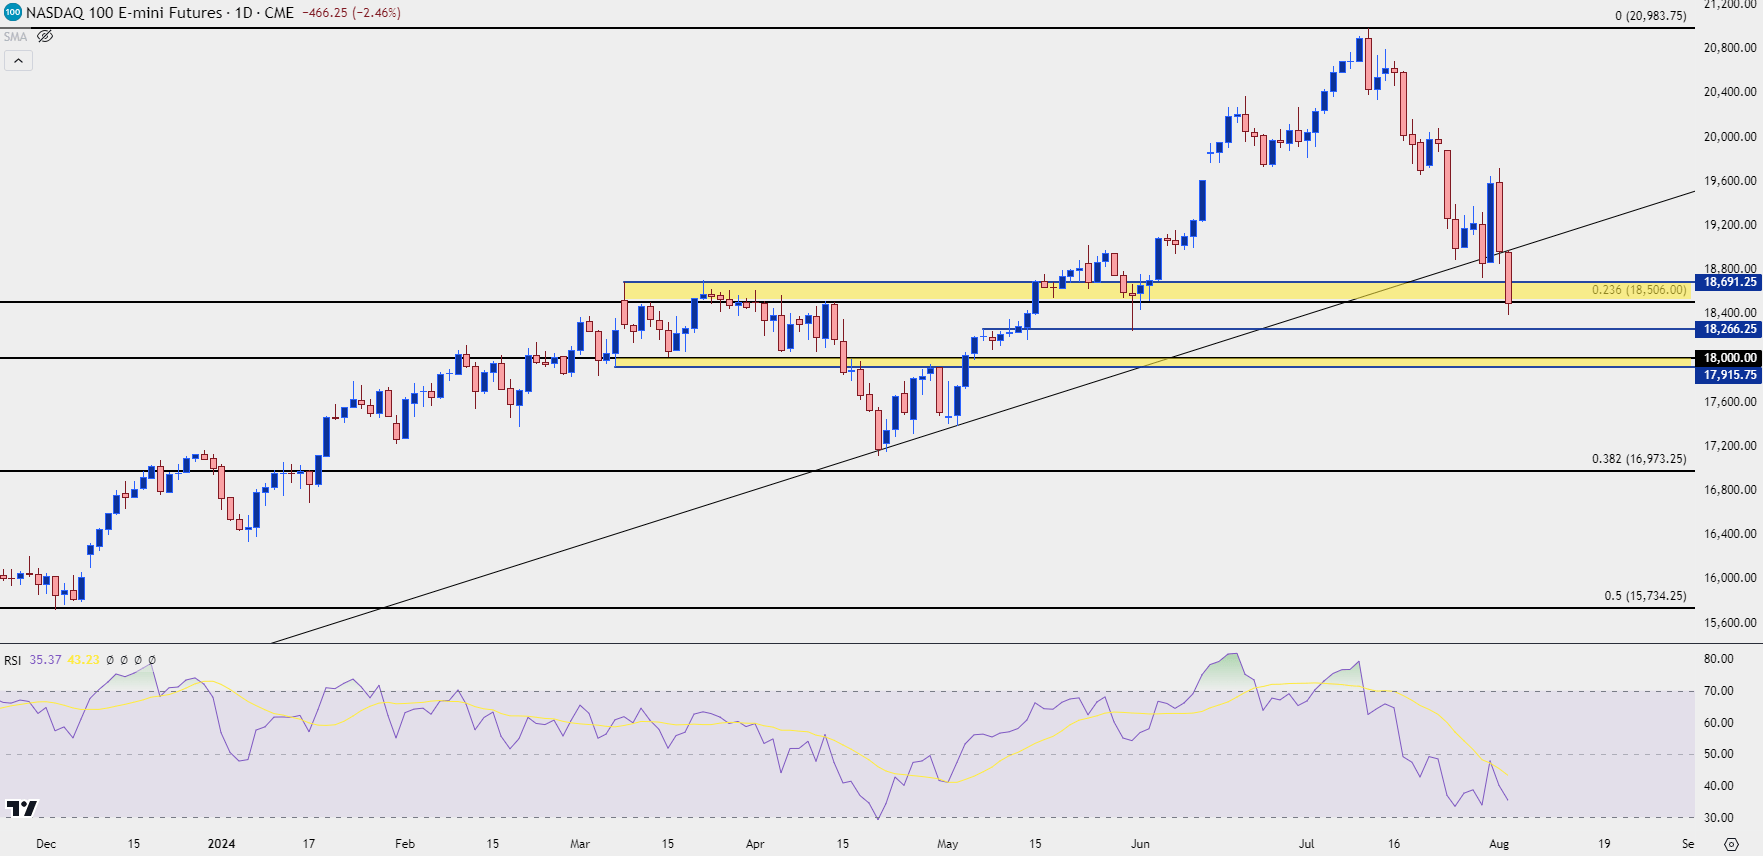 Chart prepared by James Stanley; data derived from Tradingview
--- written by James Stanley, Senior Strategist


