
S&P 500, Nasdaq, Dow Jones Talking Points:
- Nasdaq and S&P 500 Futures both established fresh all-time-highs last week, with Dow futures holding resistance at the 50% mark of the Q2 pullback.
- US data was relatively strong in the past week with the Wednesday services PMI print offsetting the Monday manufacturing PMI print; and NFP finished the week with a very strong showing as the headline number was almost 50% than the expected with Average Hourly Earnings ticking back above 4%.
- Next week is all about the Fed and it’s a quarterly meeting which means updated guidance and projections. This will likely be the major push point. I’ll be previewing this in the Tuesday webinar and you’re welcome to join: Click here to register.
Both the S&P 500 and Nasdaq 100 saw futures markets push into fresh all-time-highs last week, continuing the bounce that started just ahead of the May open. This reversed the Q2 pullback that had shown across US equities and notably, the Dow continues to lag. As of this writing Dow futures are holding resistance at the 50% mark of the Q2 pullback.
Perhaps most impressively stocks seemed to shrug off a surge in Treasury yields on Friday, and that was after a strong slate of data from US markets that showed in the back-half of the week. This leads into the big event with the Federal Reserve on Wednesday and this could take a notable toll on markets.
Of late, the Fed has continued to sound dovish which has been the name of the game since their rate decision on November 1st of last year. This has had an incredible impact on the equity market with the rally from the October lows running for more than 30% in S&P 500 futures, up to last week’s high.
On the below chart, I’ve marked each FOMC rate decision announcement going back to last June with a vertical line. You’ll notice that for several of these occurrences, the trends established around those meetings tended to push for a while after. With the notable exception of the March meeting, which was the last set of projections and forecasts supplied by the Fed. That occurrence ran into the Q2 open, at which point there were a few different indications of possible pullback, as I had shared in the Q2 forecast for equities.
S&P 500 Futures – Daily Chart – FOMC Meeting Announcements Highlighted
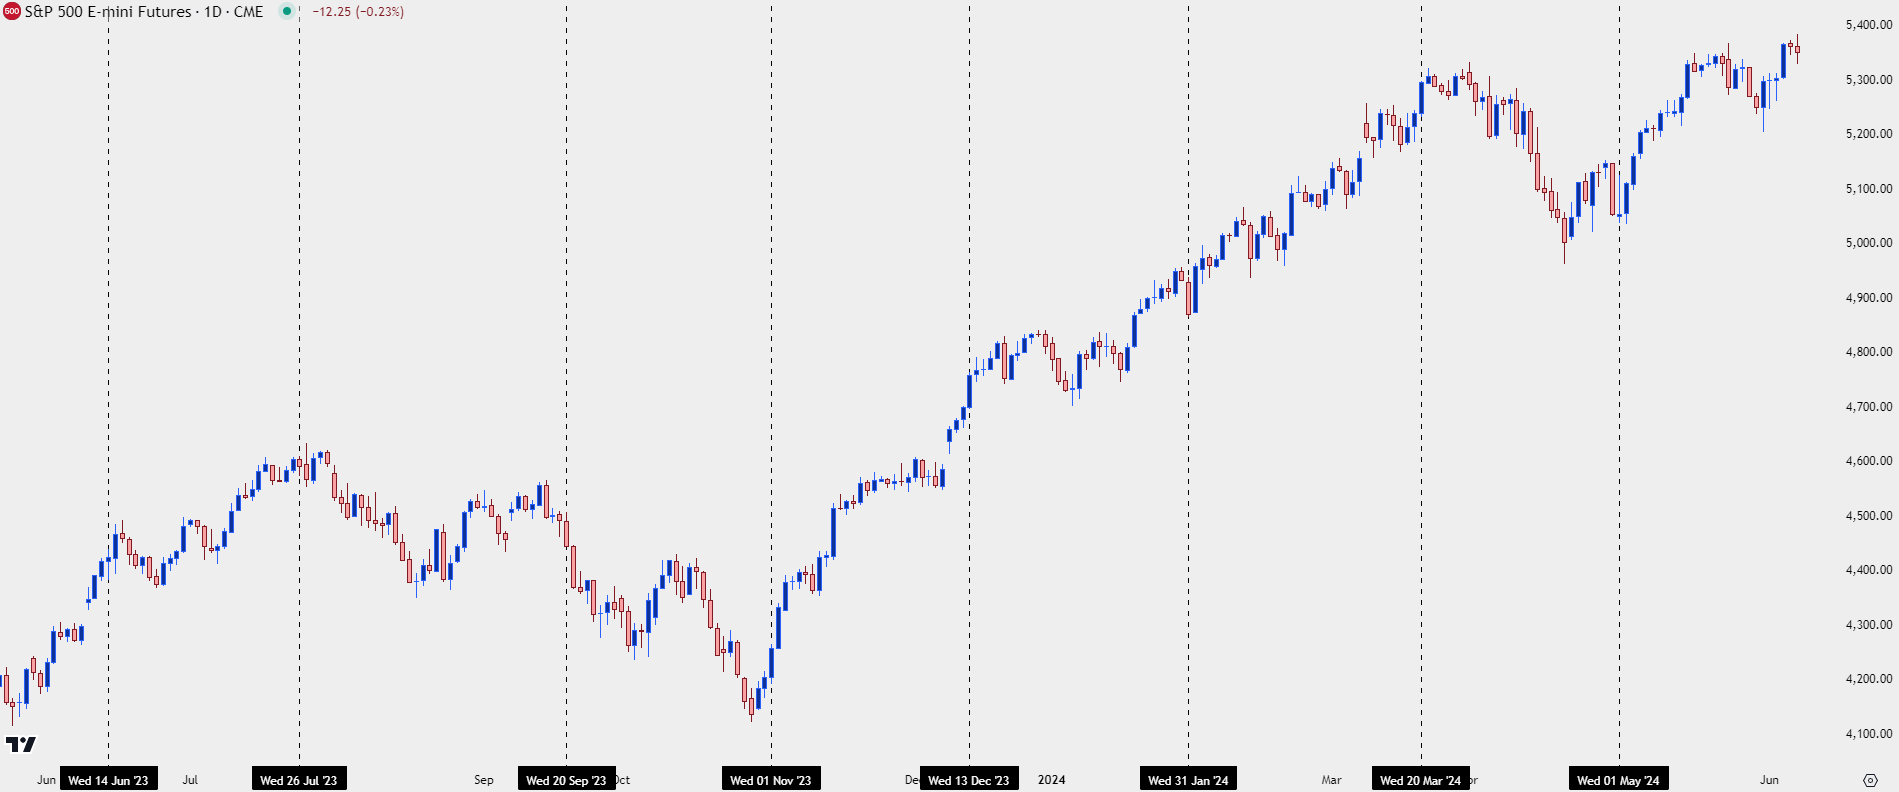 Chart prepared by James Stanley; data derived from Tradingview
The FOMC – Higher for Longer but How Long?
At the most recent release of the Summary of Economic Projections at the March meeting, the Fed highlighted the possibility of three cuts in 2024. Mathematically, that is difficult to imagine at this point, although the door does remain open for two cuts per CME Fedwatch. As of this writing, there’s an 85.4% probability of getting at least one cut by the end of the year per that data point, and a 44.9% probability of getting at least two cuts by the end of 2024.
This is very interesting considering that both parts of the Fed’s dual mandate suggests that the fight with inflation may not yet be over. Core PCE has printed at 2.8% for the past three months and Core CPI was at 3.6% at its last read in mid-May. While that was a fresh three-year-low for the latter data point, its still far above the Fed’s 2% target. And the labor market, as we saw in this week’s NFP report, similarly remains strong.
But the Fed has been so dovish despite this strength that markets continue to harbor the expectation for cuts starting at some point this year, and that’s what the Fed will have to speak to on Wednesday with their updated economic projections.
Rate Probabilities into the End of 2024
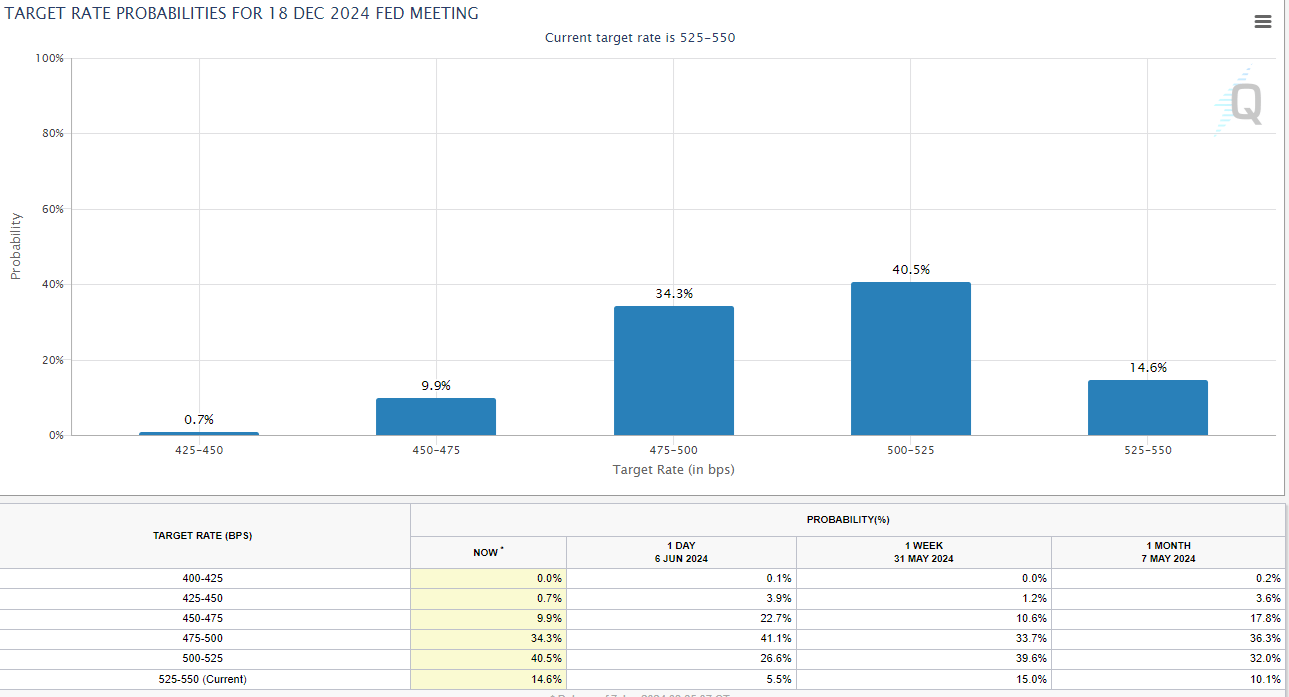 Chart prepared by James Stanley; data derived from CME Fedwatch
S&P 500
Of recent S&P 500 futures have shown a tendency to stall at or near the highs. The index set a fresh all-time-high on the first day of Q2 trade, but sellers came in at a Fibonacci extension plotted at 5334 and that began to prod a pullback. The US CPI report on April 10th came in above expectation, and that gave bears another push and sellers were in control for another week-and-a-half after.
Support eventually showed at the 5k level in S&P 500 futures. Bulls returned the next week, albeit with a degree of trepidation, and there was another strong sell-off on April 30th, the day before the Fed’s most recent rate decision was announced. But on May 1st Jerome Powell continued to sound dovish and the NFP report two days later was the first in which the headline number printed below expectations. That pushed a breakout and bulls were firmly back in-control the week after.
The May 15th US CPI print is of note, as that’s what pushed the next breakout in stocks and S&P 500 futures were able to set a fresh all-time-high. But that’s again where the index began to show symptoms of stall and for much of the past three weeks, that’s been the name of the game.
Despite the churn, bulls were able to exhibit control over the past week with a large push on Wednesday after the services PMI print. And on Friday, after the very strong NFP report, the pullback in ES was moderated with support showing at that same spot of prior resistance.
This keeps bulls in the driver’s seat for now: But should the Fed get more-hawkish in guidance next week, there would be an open door for pullback potential. The 5285-5300 area would be key support for bulls to retain to remain in control of the trend.
S&P 500 Futures (ES) – Daily Chart
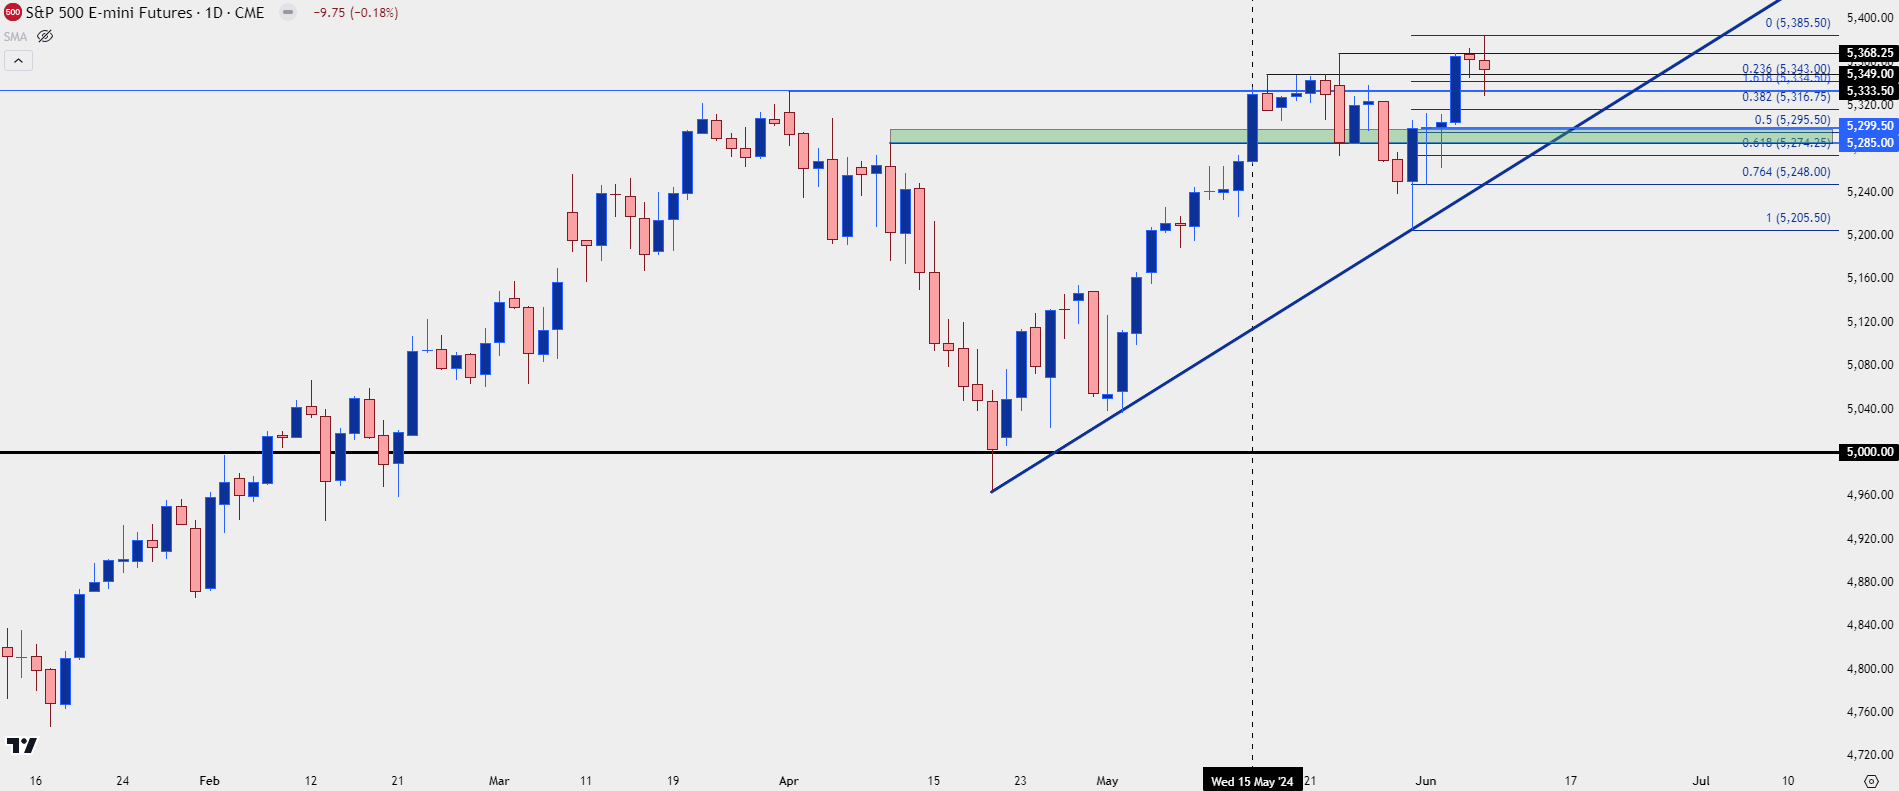 Chart prepared by James Stanley; data derived from Tradingview
Nasdaq 19k
While the S&P 500 has been strong, the Nasdaq has been stronger, and this seems to be illustrative of the market’s mood. The AI push has continued and NVDIA had another very strong week. I looked into this around NVDA earnings last month, and that’s what helped to lead into the initial test of the 19k psychological level in the index.
From last November’s low Nasdaq futures have been up by as much as 35.46% compared to the 30.64% of the S&P 500. And from the April lows, NQ has been up by as much as 11.93% while ES has gained as much as 8.5%. So, for bullish continuation scenarios in equities the argument could still be made that the Nasdaq offers a more attractive backdrop, as pushed by the AI theme.
With that said, there’s also been a similar dynamic of bulls shying away from the highs or near resistance, while remaining very active on pullbacks or near support. The 19k level that offered resistance in May is now being tested for support, and the next support level that I’m tracking is somewhat far away at 18,691, which was the double top that held into the Q2 open.
Nasdaq 100 Futures (NQ) – Daily Chart
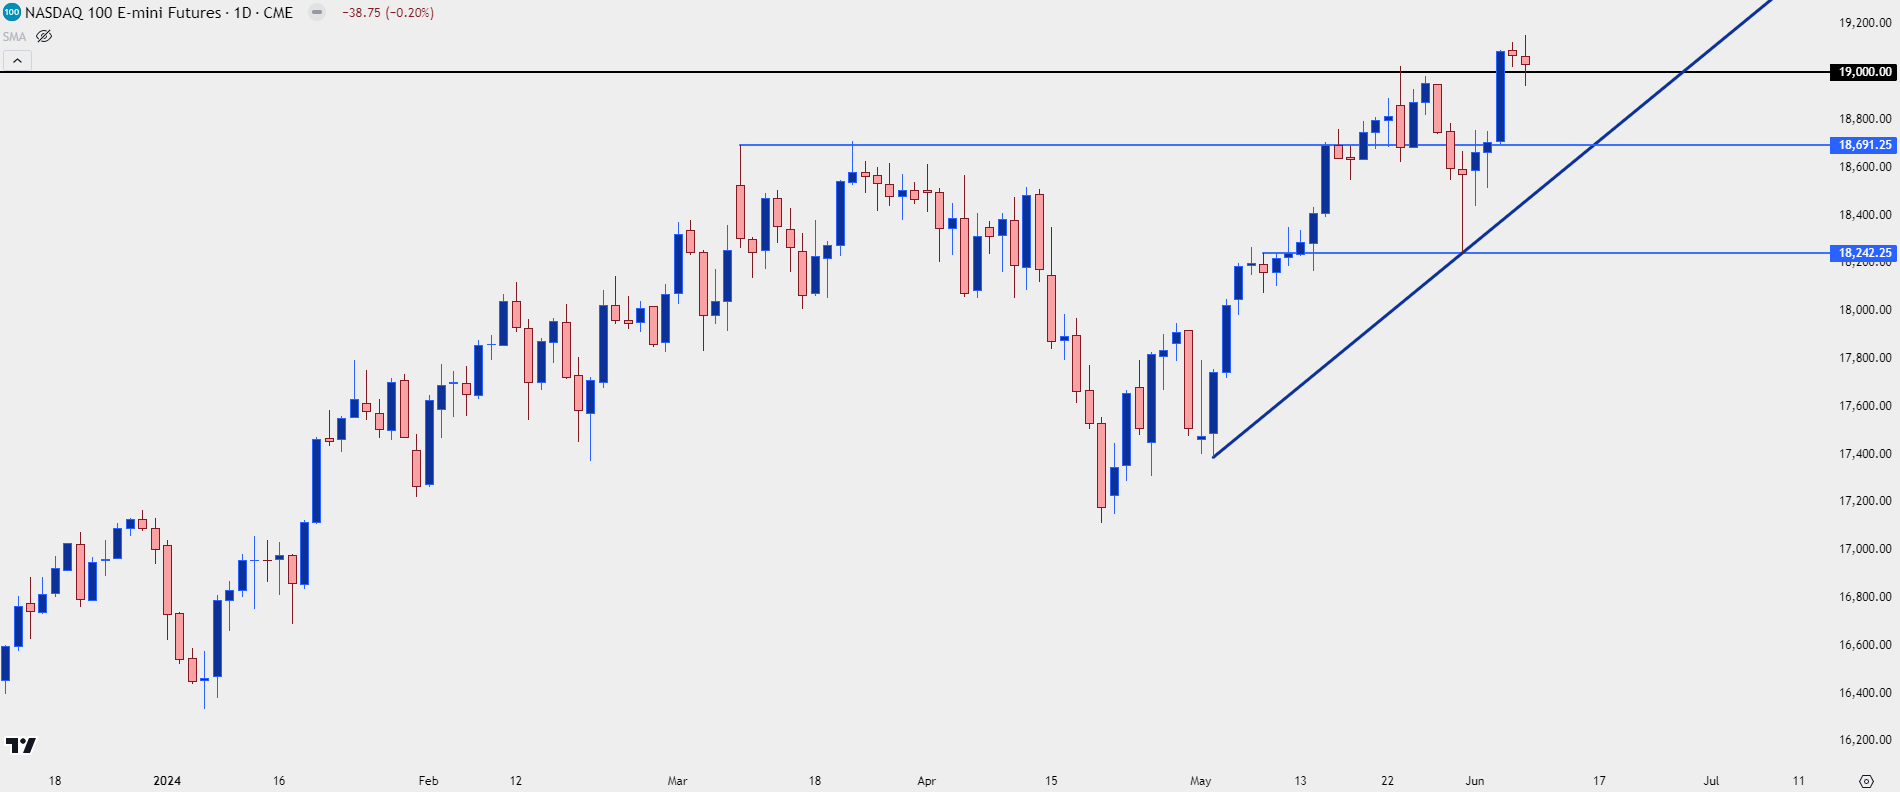 Chart prepared by James Stanley; data derived from Tradingview
Dow Jones
I wrote about this on Thursday, noting how the Dow has lagged both the S&P 500 and Nasdaq of late. And as I explained there, one of the reasons for the divergence is NVDIA and similar issues, as it’s been a very AI-driven bull market and NVDA is not in the Dow index. At the close of the week, Dow futures held resistance inside the 50% mark of the Q2 pullback move, standing in contrast to both indices looked at above.
Dow Futures (YM) – Weekly Chart
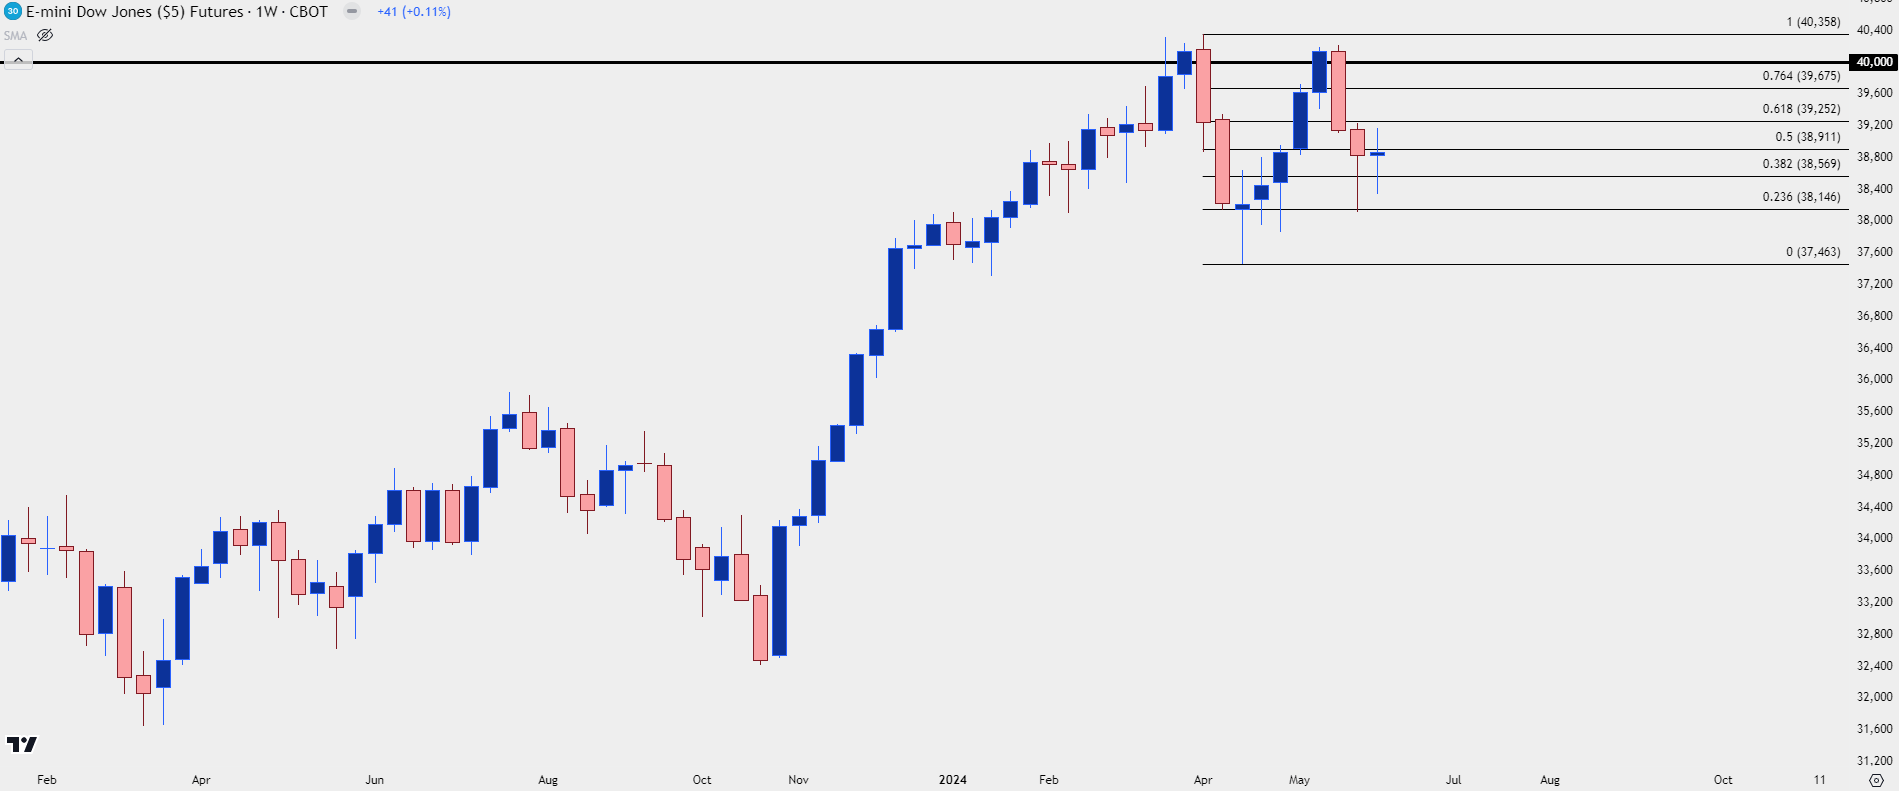 Chart prepared by James Stanley; data derived from Tradingview
Dow 40k
I had written about this in the equities forecast for 2024, highlighting how the 40k psychological level could be a hindrance for the Dow. YM pushed into that level in March and despite a few daily closes above that threshold, was unable to hold above the move. That level came into play again in May, just after the US CPI report; but, again, bulls had difficulty mounting any substantial strength above that level and price fell back to the 23.6% Fibonacci retracement of the pullback move.
So, there may be an overhang of psychological resistance at-play, but notably, the rally from the October lows only spanned as much as 24.53% (against 30.64% and 35.64% in S&P 500 and Nasdaq futures, respectively).
If the Fed does sound a bit more-hawkish next week, and equities do show a pullback, the Dow could remain as an attractive candidate for such themes. On Friday, resistance held at the weekly high as taken from a trendline projection drawn from April and early-May swing lows.
Dow Jones Futures (YM) – Daily Chart
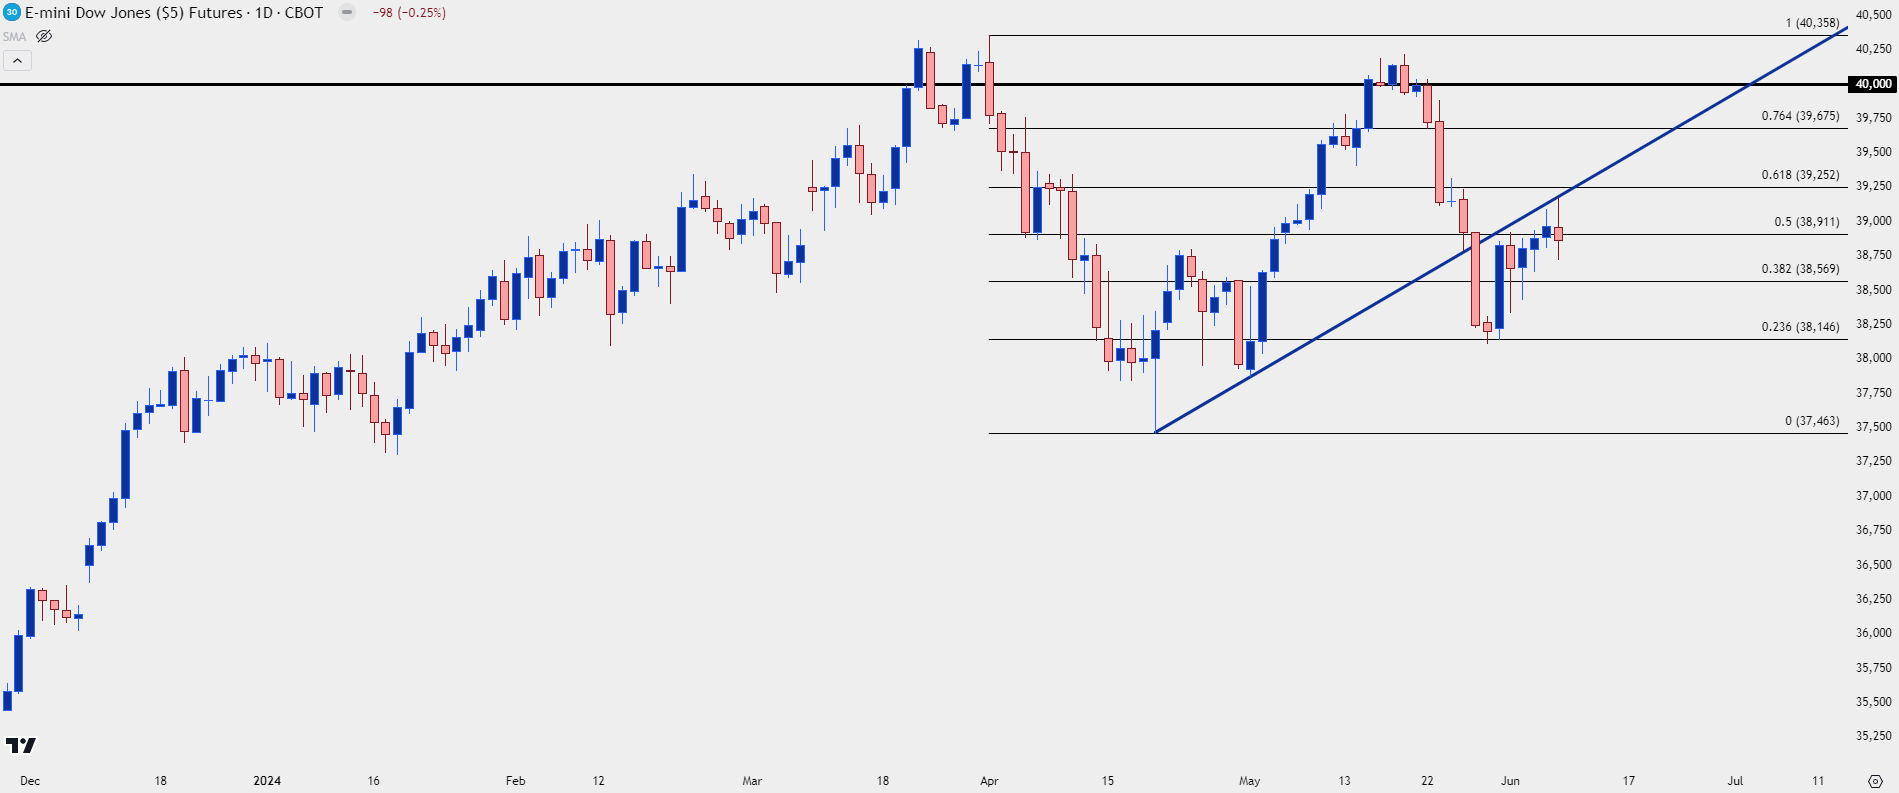 Chart prepared by James Stanley; data derived from Tradingview
--- written by James Stanley, Senior Strategist


