S&P 500, Dow Jones Talking Points:
- Both the Nasdaq 100 and S&P 500 have set fresh all-time-highs while the Dow Jones Industrial Average has underperformed after snapping back from the 40k level.
- Tomorrow brings NFP and next Wednesday the FOMC, which will likely keep stocks on the move as markets look to when the Fed’s first rate cut might take place.
- If you’re looking to learn more about meshing fundamental analysis with technical analysis, the Trader’s Course focuses on both. More information can be found at the following link: The Trader’s Course
S&P 500 futures have pushed up to a fresh all-time-high and so has the tech-heavy Nasdaq. Interestingly, the same can’t be said about the Dow which continues to hold below the 40k psychological level that came into play in mid-May.
I had warned of the 40k level in the Dow in the 2024 Forecast for equities and in Dow futures, that price has now held two separate tests with bulls unable to leave it behind. The S&P 500 has retained a more bullish look of recent, but there’s also been a bit of trepidation from buyers when prices have pressed up to fresh highs, such as we’re seeing now.
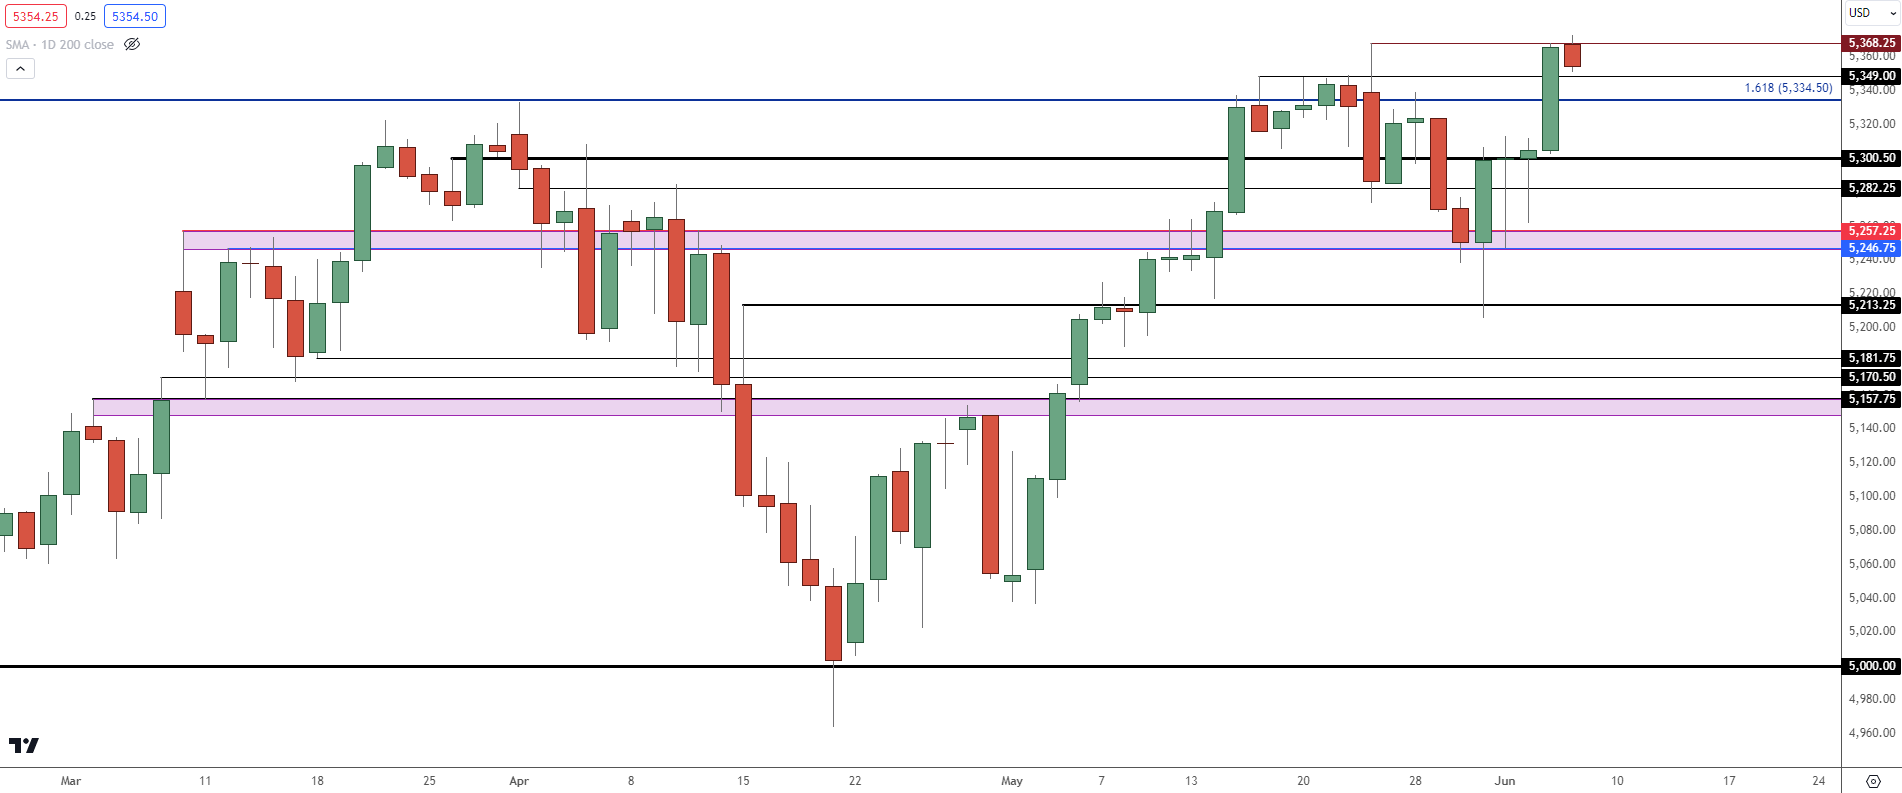
From the below chart, we can see that fresh high earlier on the day in S&P 500 futures, but bulls weren’t able to break much fresh ground above the May 23rd high. With price stalling at a fresh high this can be an open door for longs to take profits, which can lead to greater supply and pullbacks – with the big question where bulls might look to re-enter to take part in the trend.
This was a similar scenario to last week: Buyers showed up to support the 5213 level and then the 5246 level. And after a few days of grind at 5300, they were finally able to stretch up to that fresh all-time-high.
S&P 500 Futures Daily Price Chart
 Chart prepared by James Stanley; data derived from Tradingview
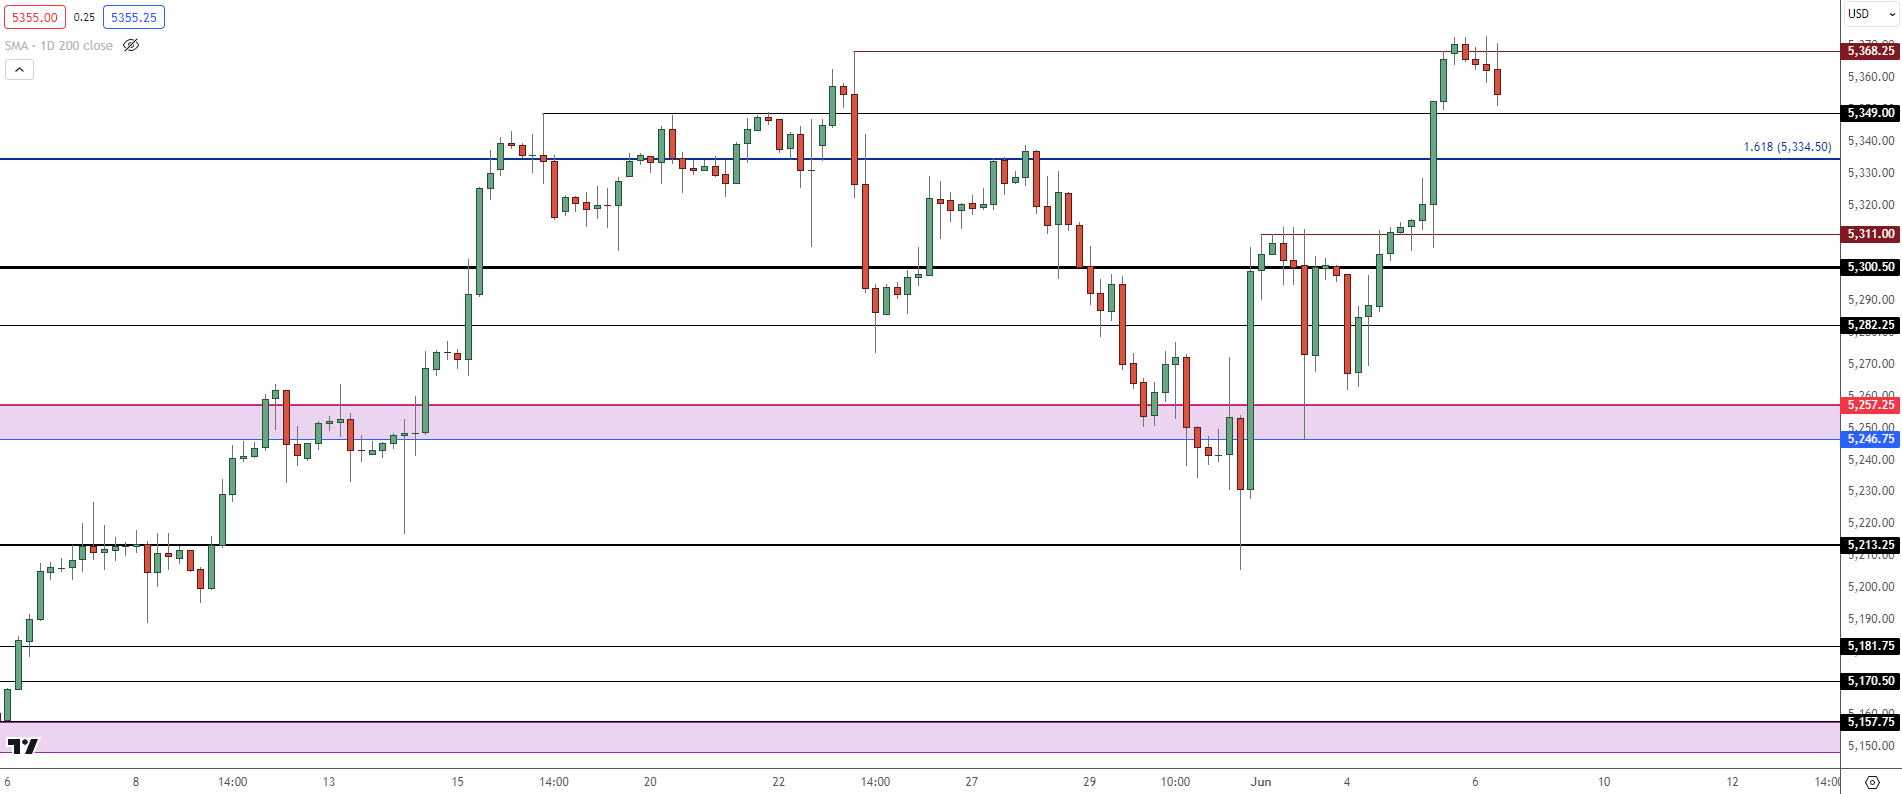
On a shorter-term basis, we can see where bulls have been very responsive to support over the past week.
Last Friday morning there was a strong reversal move off the 5213 level in S&P 500 futures. And then on Monday, a similar impact at the 5346 level.
There are a few more areas of interest for higher-low support that are coming into view: A prior swing high at 5350 and then a Fibonacci extension that had held the high on the first day of Q1 trade at 5334. There’s resistance-turned-support at 5311, and then the psychological level of 5300 which had held the highs on Friday and Monday.
S&P 500 Futures Four-Hour Price Chart
 Chart prepared by James Stanley; data derived from Tradingview
The Dow
While the S&P has remained hot with a fresh all-time-high, the Dow looks considerably different, and there are a couple of nuances worth noting here.
First and foremost, the Dow Jones Industrial Average does not include NVDIA, which has very much been a leader in the rally. It’s also just generally lighter on technology companies which, again, has been a leader during the most recent market theme.
This isn’t to say that the index hasn’t had strength in 2024 but it has been to a far lesser degree than what’s shown in the Nasdaq or S&P.
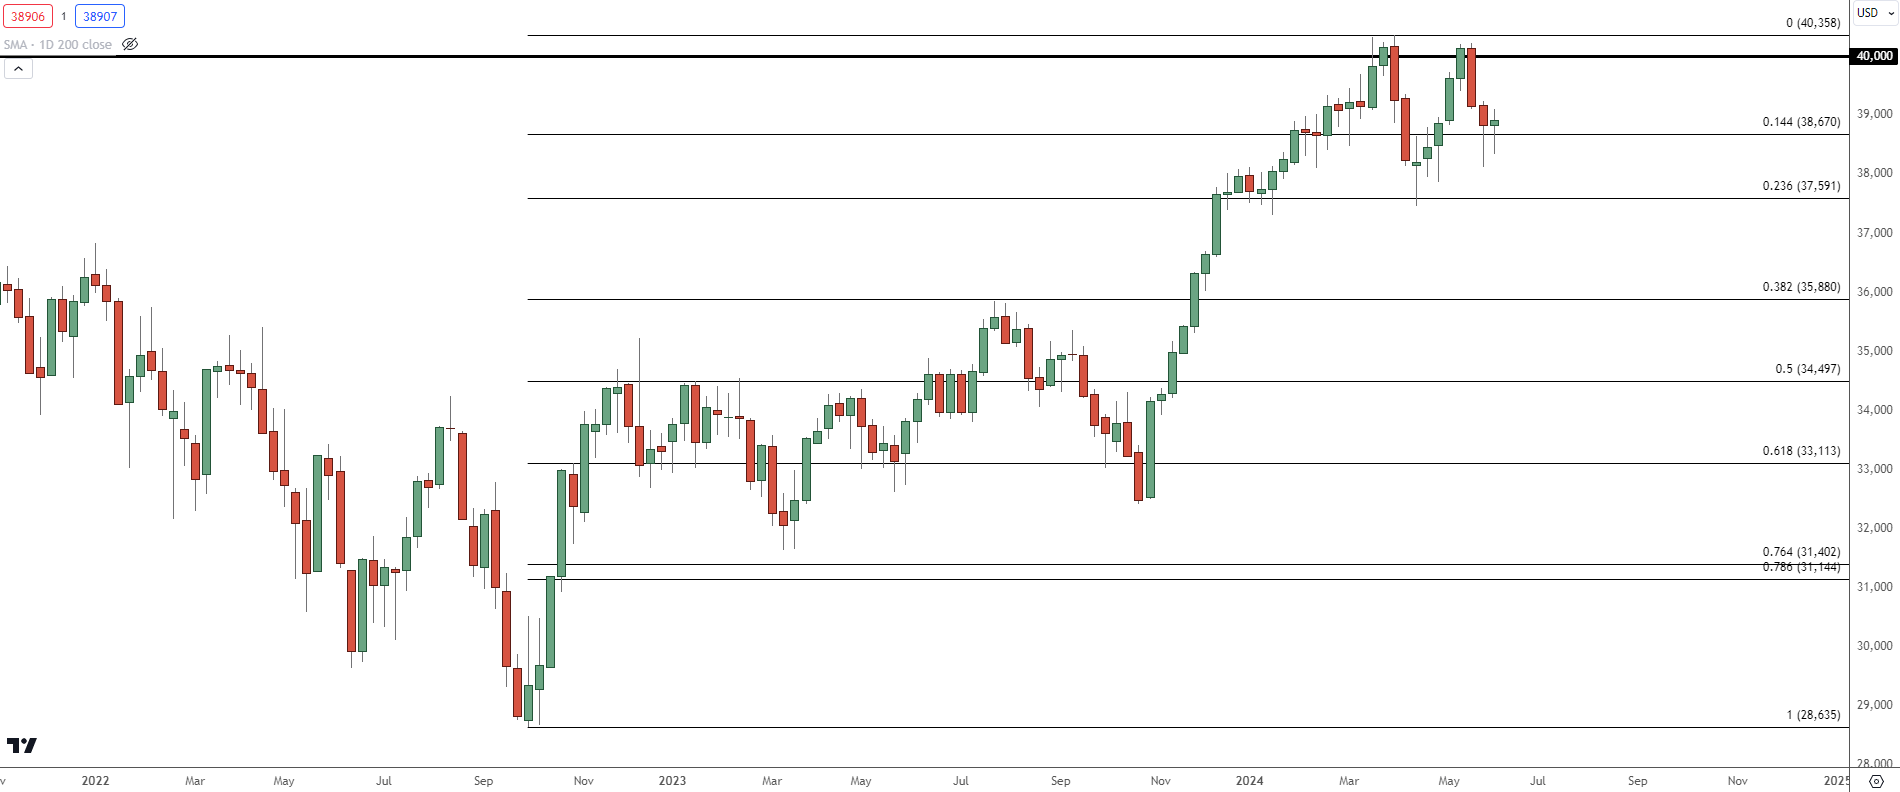
In Dow futures, the index tested above the 40k level in March and even had a weekly close above that level. But as the Q2 open took over, so did a pullback in stocks and this was the same that I had warned about in the Q2 Forecast for Equities. That pullback ran for 23.6% of the October-April move, with support eventually showing on April 19th.
Dow Jones Futures Weekly Chart
 Chart prepared by James Stanley; data derived from Tradingview
The second test of 40k also showed a lower-high and in late-May another pullback developed. Last Friday saw a similar bounce in the Dow that showed in NQ and ES and so far this week, bulls have continued to push.
At this point, it could be difficult to substantiate an argument for Dow strength over strength in the Nasdaq 100, and perhaps even the S&P 500. And for those that do want to take a bearish stance on equities, this deviation could make the Dow as a more attractive candidate for such.
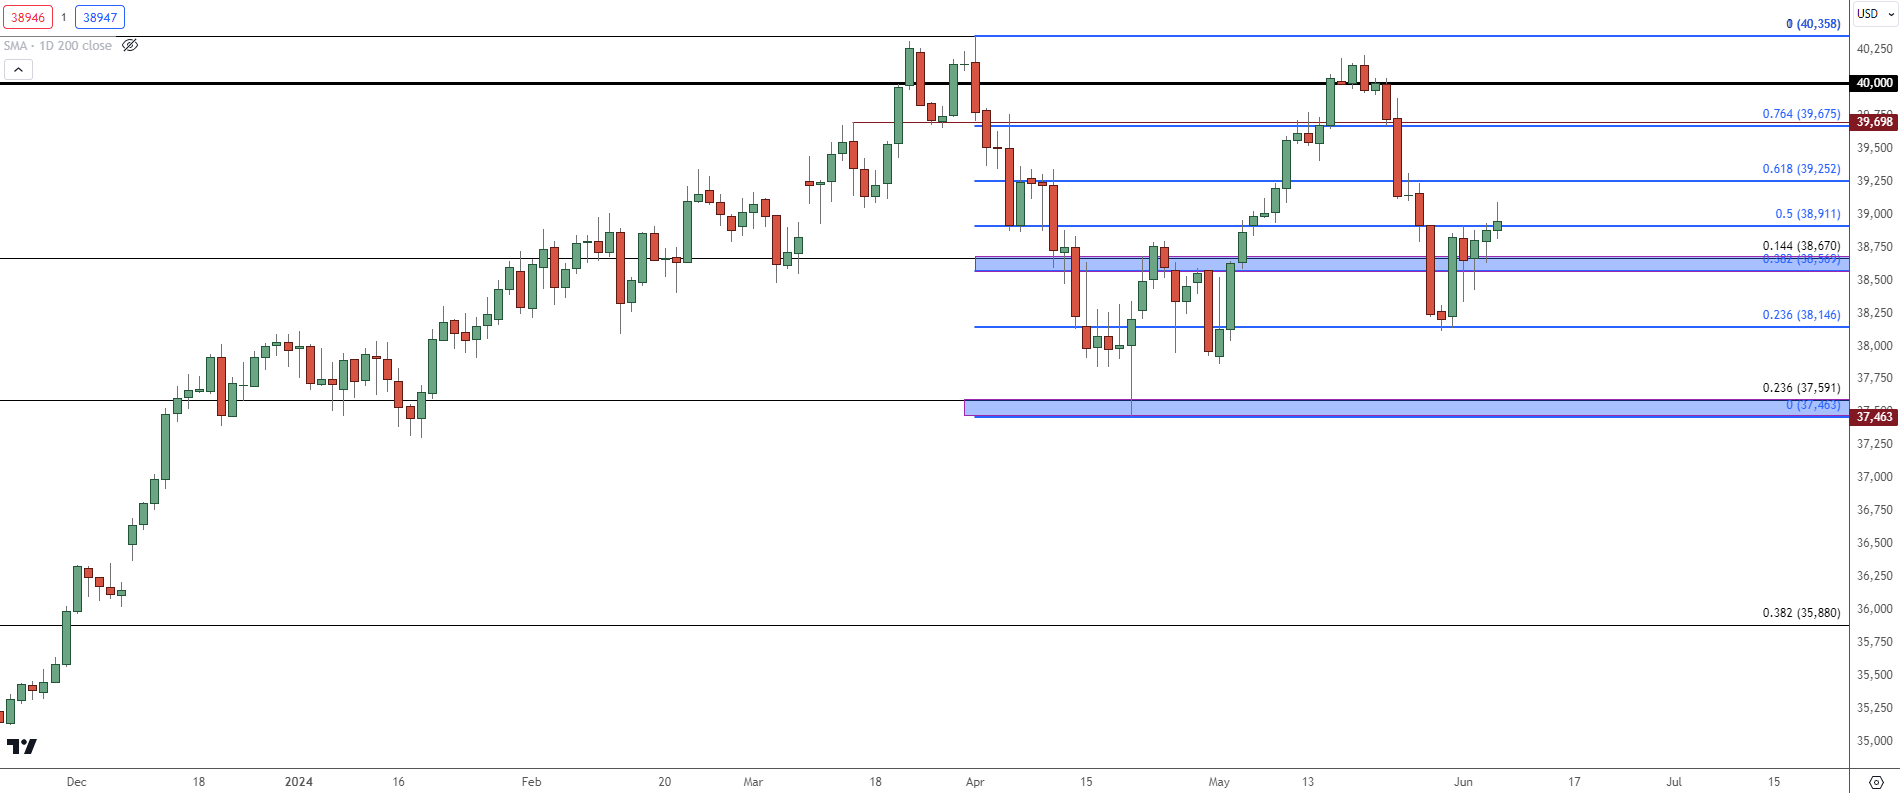
The big question at that point is whether another lower-high appears inside of the 40k level. And given the Q2 grind, there’s quite a bit of prior price history in the area from 40k down to the April low of 37,463.
At this point, price is holding the 50% mark of the Q2 range. The 76.4% Fibonacci retracement of that study at 39,675 plots very near a prior price swing of 36,698, creating a zone of resistance potential.
For support, there’s a zone between two Fibonacci retracement levels at 38,569 and 38,670. If bulls lose control of that and if bears can push below, the focus then shifts to the 23.6% retracement at 38,146. Below that is a key support zone, taken from the Q2 low at 37,463 up to the 23.6% retracement of the longer-term move looked at earlier which plots at 37,591.
Dow Jones Daily Price Chart
 Chart prepared by James Stanley; data derived from Tradingview
--- written by James Stanley, Senior Strategist


