
Equities, S&P 500, Nasdaq 100, NVDA Talking Points:
- Stocks are showing another impressive rally after yesterday’s earnings report from NVDA.
- There’s a mania-like feel across many individual equities at the moment and those can be surprisingly difficult to work with as a trader, given that sharp rallies can lead to wide pullbacks, which become problematic from a risk management perspective.
- While what we’re seeing displays symptoms of a mania – that does not mean that it has to collapse or crash anytime soon. As I wrote in this year’s Equities forecast, my expectation was that the Fed and Treasury would continue to try to support these rallies, and we’ve seen that over the past week and a half, explained further below.
- I’ll be discussing these themes in-depth in the weekly webinar. It’s free for all to register: Click here to register.
Equities are displaying mania-like symptoms in the U.S., and that’s ramped up a degree or two today following the massive breakout in NVDIA shares after yesterday’s earnings report. This has sent the S&P 500 to a fresh all-time-high, and the Nasdaq 100 is pushing back towards its prior ATH, erasing the pullback that had shown since last Friday.
From the weekly chart, these moves look practically parabolic as we can see in S&P 500 futures below. And while that very clear recent bias may make matters of instituting strategy seem simpler; these moves can be difficult to work with as stronger trends can lead to wider pullbacks, which pose a problem from a risk management perspective.
S&P 500 Futures – Weekly Chart
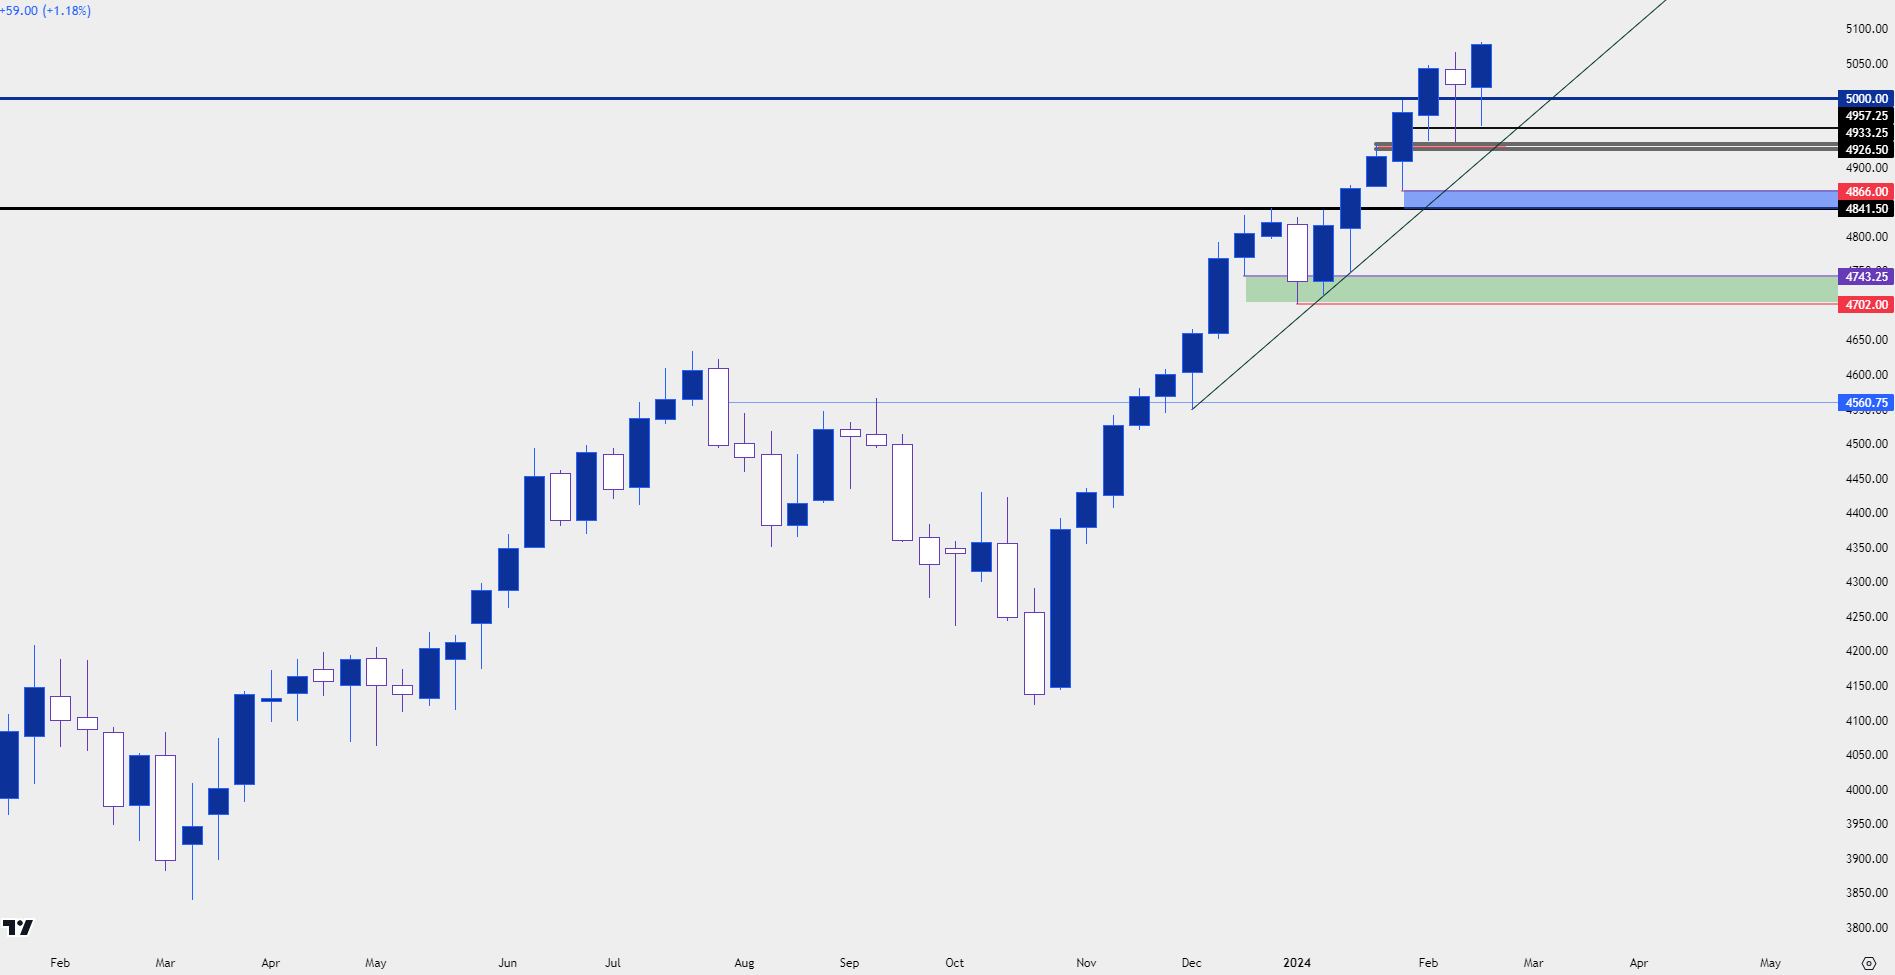 Chart prepared by James Stanley; data derived from Tradingview
There was building scope for a pullback last week. The U.S. CPI report on Tuesday beat expectations and in short order stocks had started to pull back and even darlings like NVDIA weren’t left unscathed. This caused a fast re-shuffling of rate expectations as stubborn inflation presents a more difficult case for the Fed to cut rates later this year. And to be sure, its that prospect of rate cuts that’s helped to volley this move across equities.
But, actually cutting rates may not be the panacea that many are hoping for, as the very act of pushing short-term rates lower can create demand in bonds and, if strong enough, that can draw capital flows away from stocks. So the act of cutting rates could be a risk to equity rallies; but the pricing in of rate cuts, well that could be a large positive for markets dreaming on softer economic backdrops for corporates, especially tech-heavy companies carrying a high beta. And as momentum builds and more traders chase a trend, parabolic-like moves can build, such as we’ve seen over the past couple of months.
The Fed has sounded more dovish since the November 1st rate decision last year and that’s what started the slide in the U.S. Dollar. Ahead of that meeting, stocks were looking very vulnerable, fearing that the Fed would have to hike rates again as inflation remained stubbornly high. But as Powell took on a very dovish tone on November 1st markets began to price out any additional rate hikes while focusing full speed ahead on upcoming rate cuts.
At the CPI release last week, Core CPI printed at 3.9%. In October, that data point was at 4.1%. And we’ve now had five consecutive months of Core CPI holding with a 0.2% range, straddling the 4.0% level. The Fed’s target is at 2% so, if we’re looking at this data point, it would appear that we would at the least have to entertain the idea of ‘inflation entrenchment,’ which is what the Fed talked about as a risk when slowing rate hikes.
That likely played a role in the pullbacks that we saw last Tuesday after the CPI release. But, as I shared on the day after, a comment from Austan Goolsbee of the Chicago Fed seemed to spark risk-on trends along with a reversal move in the USD.
This highlights what I’ve been talking about in webinars pertinent to the U.S. Dollar, which has some tie with risk trends. It seems as though the ‘natural flow’ of the USD is higher, as a series of economic data reports have pushed a bullish trend of higher-highs and lows over the past couple of months. But each breakout has been met with dovish Fed commentary which has helped to stall that breakout and, in some cases such as we’ve seen over the past week, sparked a reversal move.
So it seems as though the Fed really doesn’t want to entertain the idea of rate hikes here, even if the data is pointing in that direction and that’s helped to keep bulls in the drivers’ seat for equities. Yesterday’s blowout earnings report was merely motivation in that same direction as it’s another sign of health in the U.S. economy. And, as I had written a week before, these types of trends can be an excellent way to get a read on market sentiment, which seems mania-like at this point.
Below I’m looking at the updated chart of NVDIA from last week’s article, with no annotations added or taken away. The structure remains relatively clean on a short-term basis; that support zone at 661.55-663 held the lows at yesterday’s close and that’s led to a slingshot breakout to fresh all-time-highs.
NVDA Two-Hour Chart
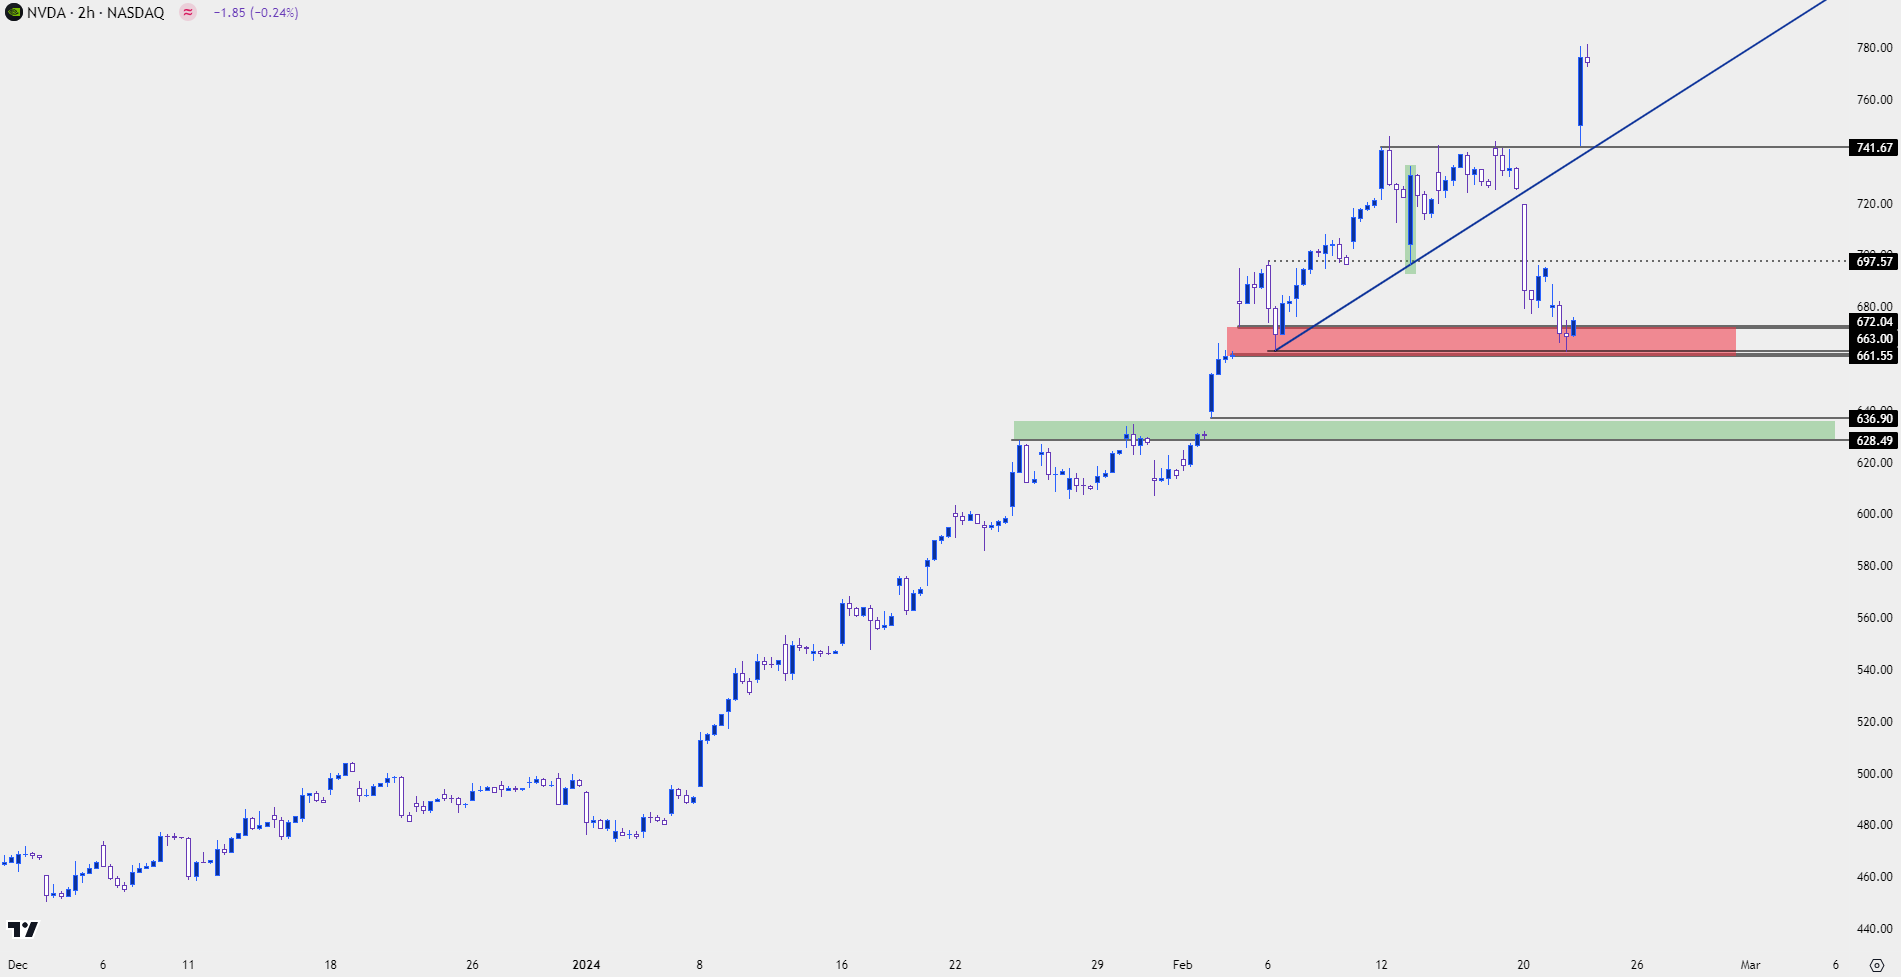 Chart prepared by James Stanley; data derived from Tradingview
S&P 500: Working with Parabolas
Is a stock or an index displaying mania-like symptoms an obvious short candidate? No. Because manias can continue for longer than a trader can eat adverse excursion. In trading, timing matters; and if leverage is the equation ‘being wrong’ is amplified even more.
Price matters, and if prices are still running-higher and bulls are forcing massive breakouts in Trillion-dollar companies after a single earnings report, there’s an incredible drive behind those moves. This is that illustration of bullish sentiment that I was talking about last week and the week before. And sure, they could perhaps turn; but something like that usually needs a driver of some sort, such as an economic data point or indicator. And we had one of those last Tuesday with the higher-than-expected CPI report. But, as we saw a day later, the Fed appears unbothered by that and similar to what was seen during the ‘transitory’ episode in 2021, the bank continues to err on the side of dovishiness which can be helpful for risk trends.
In my opinion, this is a mania, the only way to approach is to either ride the wave in the direction of the trend or to wait for some evidence of change, which hasn’t been evidence since the rally began four months ago. In the S&P 500, the swing low at 4960 continues the bullish structure and this highlights higher-low support potential at the 5k psychological level.
A little lower are zones around 4926-4933 and then from 4841-4866: If the latter zone gets tested in short-order then the recent extension of the rally will begin to look like a false breakout on the monthly chart, and that’s where some reversal hypothesis can begin to be entertained.
S&P 500 Futures Daily Price Chart
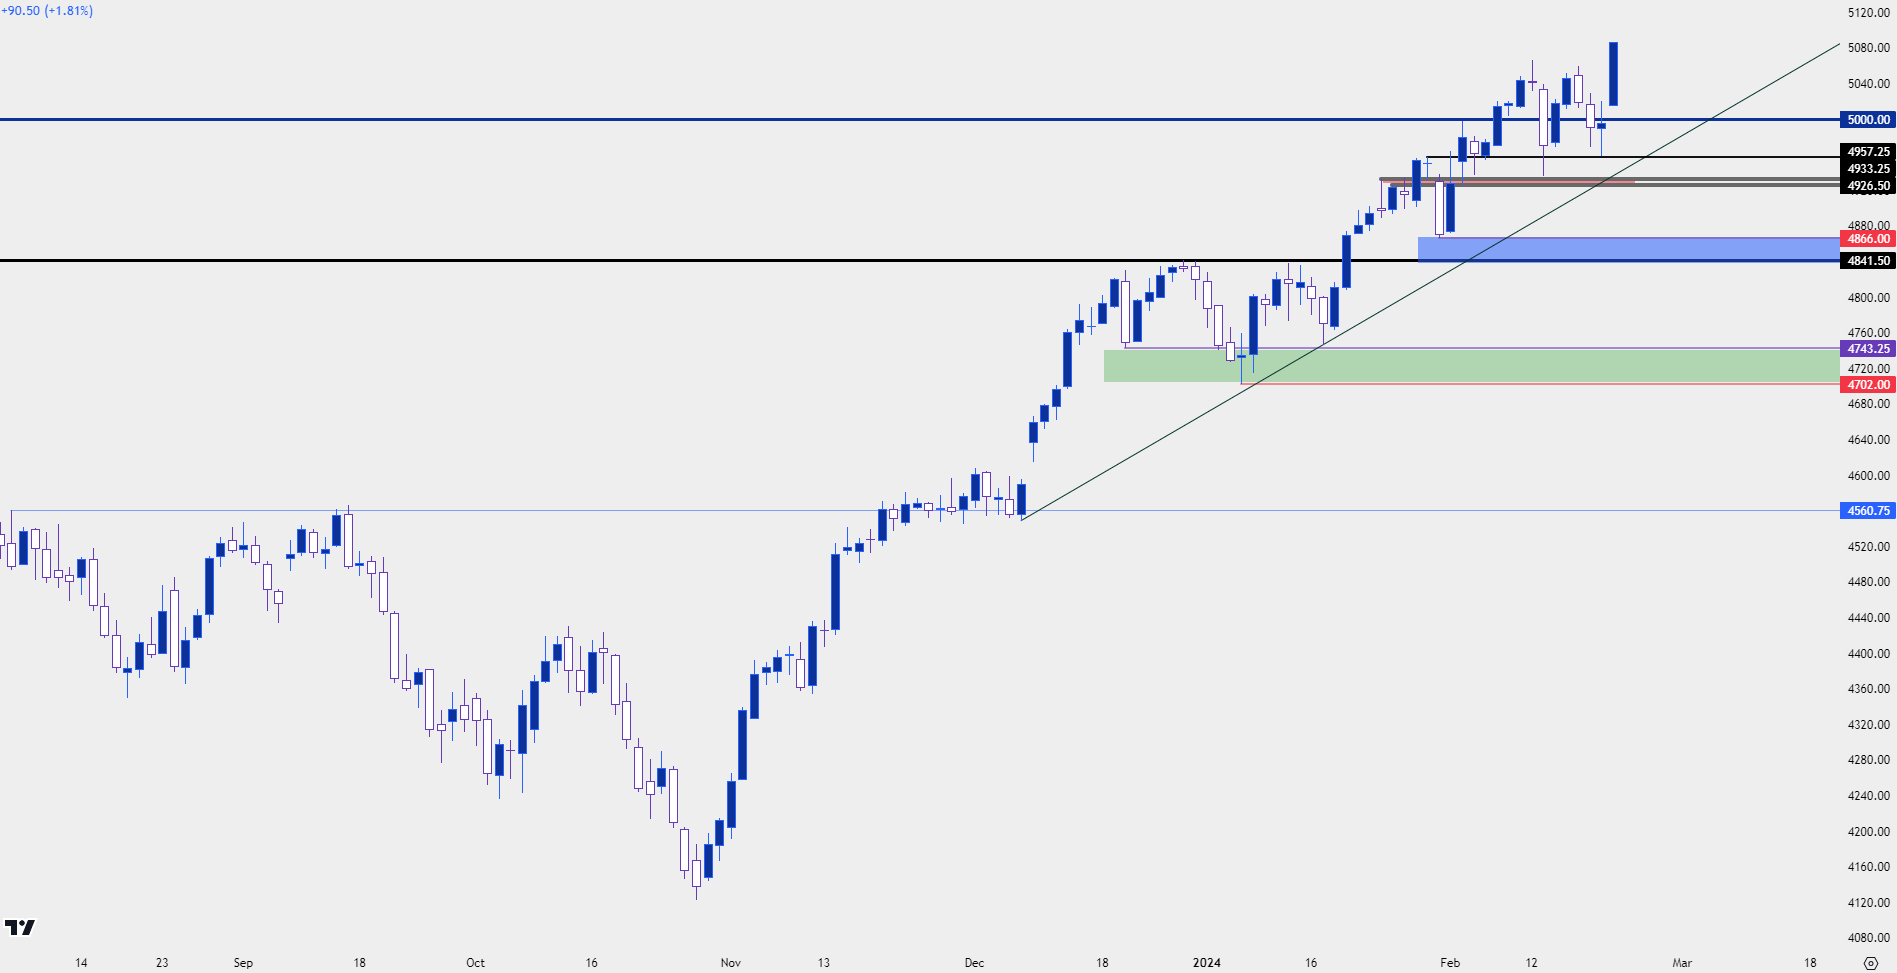 Chart prepared by James Stanley; data derived from Tradingview
Nasdaq 100
As illustration of just how strong equity trends have been, the Nasdaq 100 has gained a whopping 27% from the October lows.
Meanwhile Core CPI hasn’t softened very much as its at 3.9% now and was at 4.1% then. But rather than markets factoring in a higher probability of a possible hike or even a lower possibility of cuts starting in 2024, the index has continued to march higher. At this point, NQ is re-testing the 18k psychological level that’s been a roadblock for bulls so far in February.
Nasdaq 100 Futures – Daily Chart
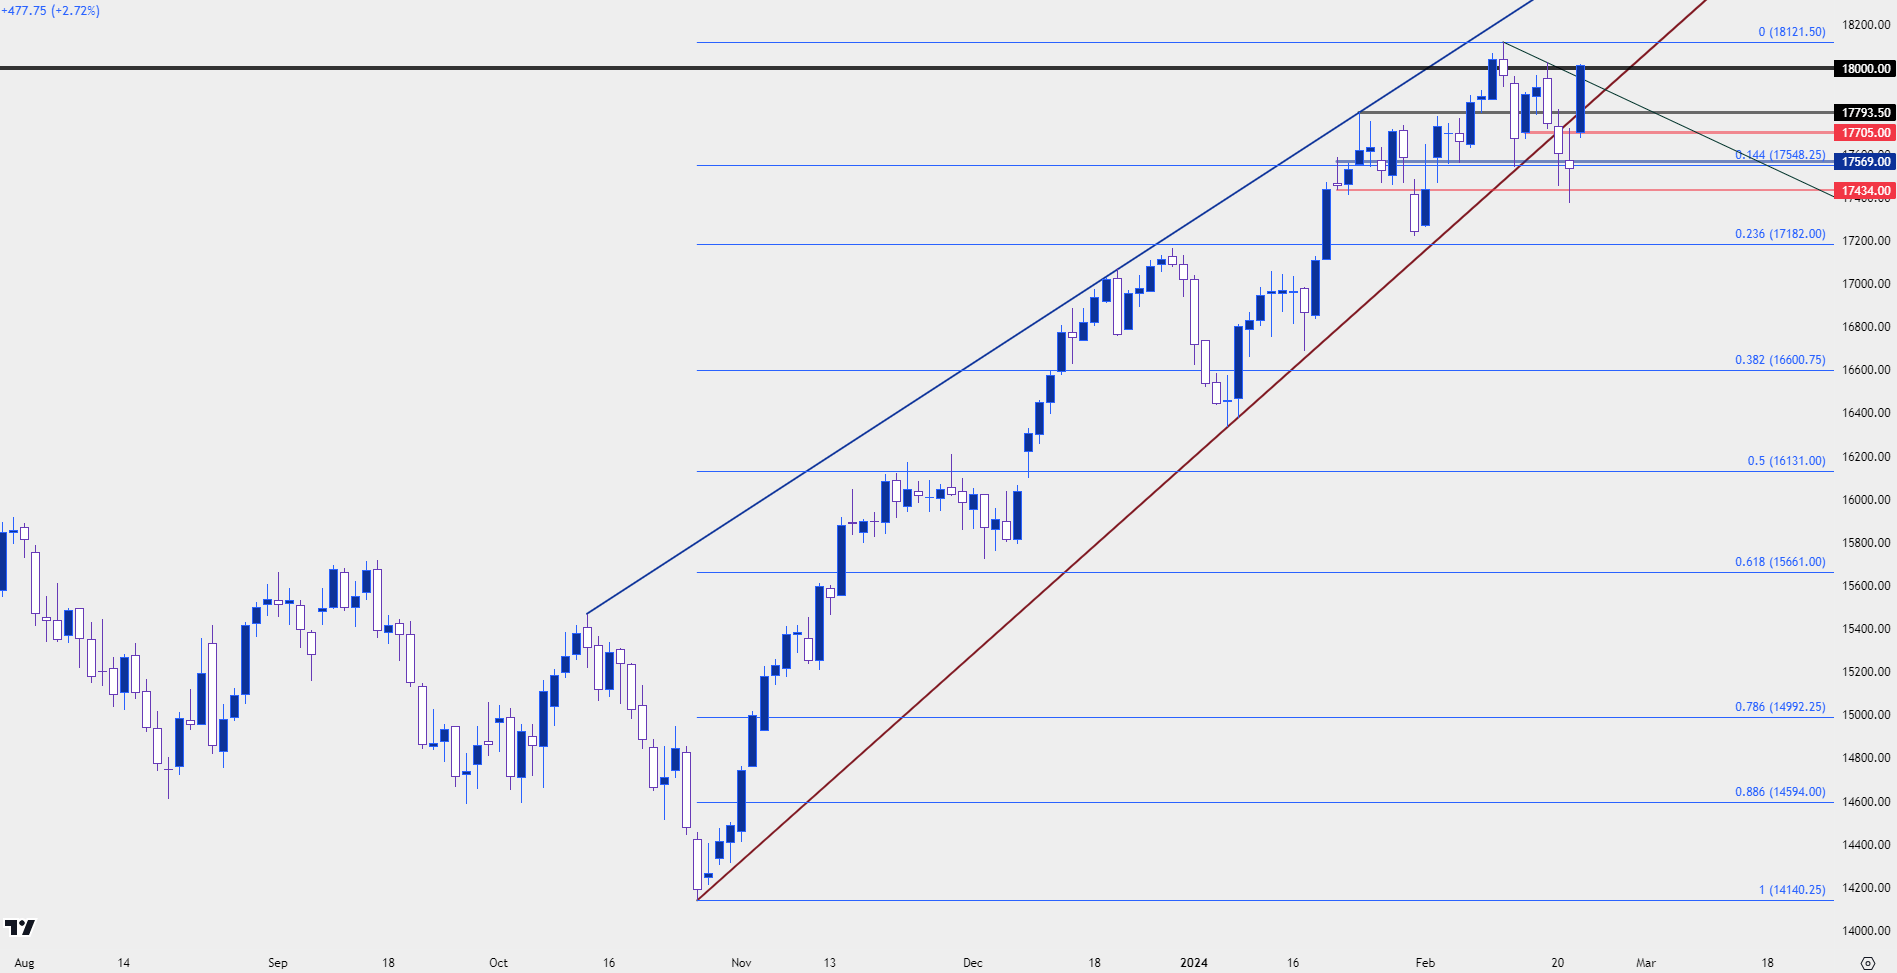 Chart prepared by James Stanley; data derived from Tradingview
The four-hour chart shows just how effusive this move has been since the NVIDA earnings report yesterday. Given how quickly this move has priced-in, this speaks to what I had mentioned at the beginning of this article, where strong trends can lead to wide pullbacks. I’m tracking support potential at 17,903, which if held, would demonstrate a strong response from bulls on an initial pullback. The next spot of support tis down around 17,793, and if that can’t hold, there’s another around 17,569. If bears make a push below the 17,434 level, then bearish scenarios could begin to be entertained as today’s rally would start to look like a failure.
Nasdaq Futures Four-Hour Price Chart
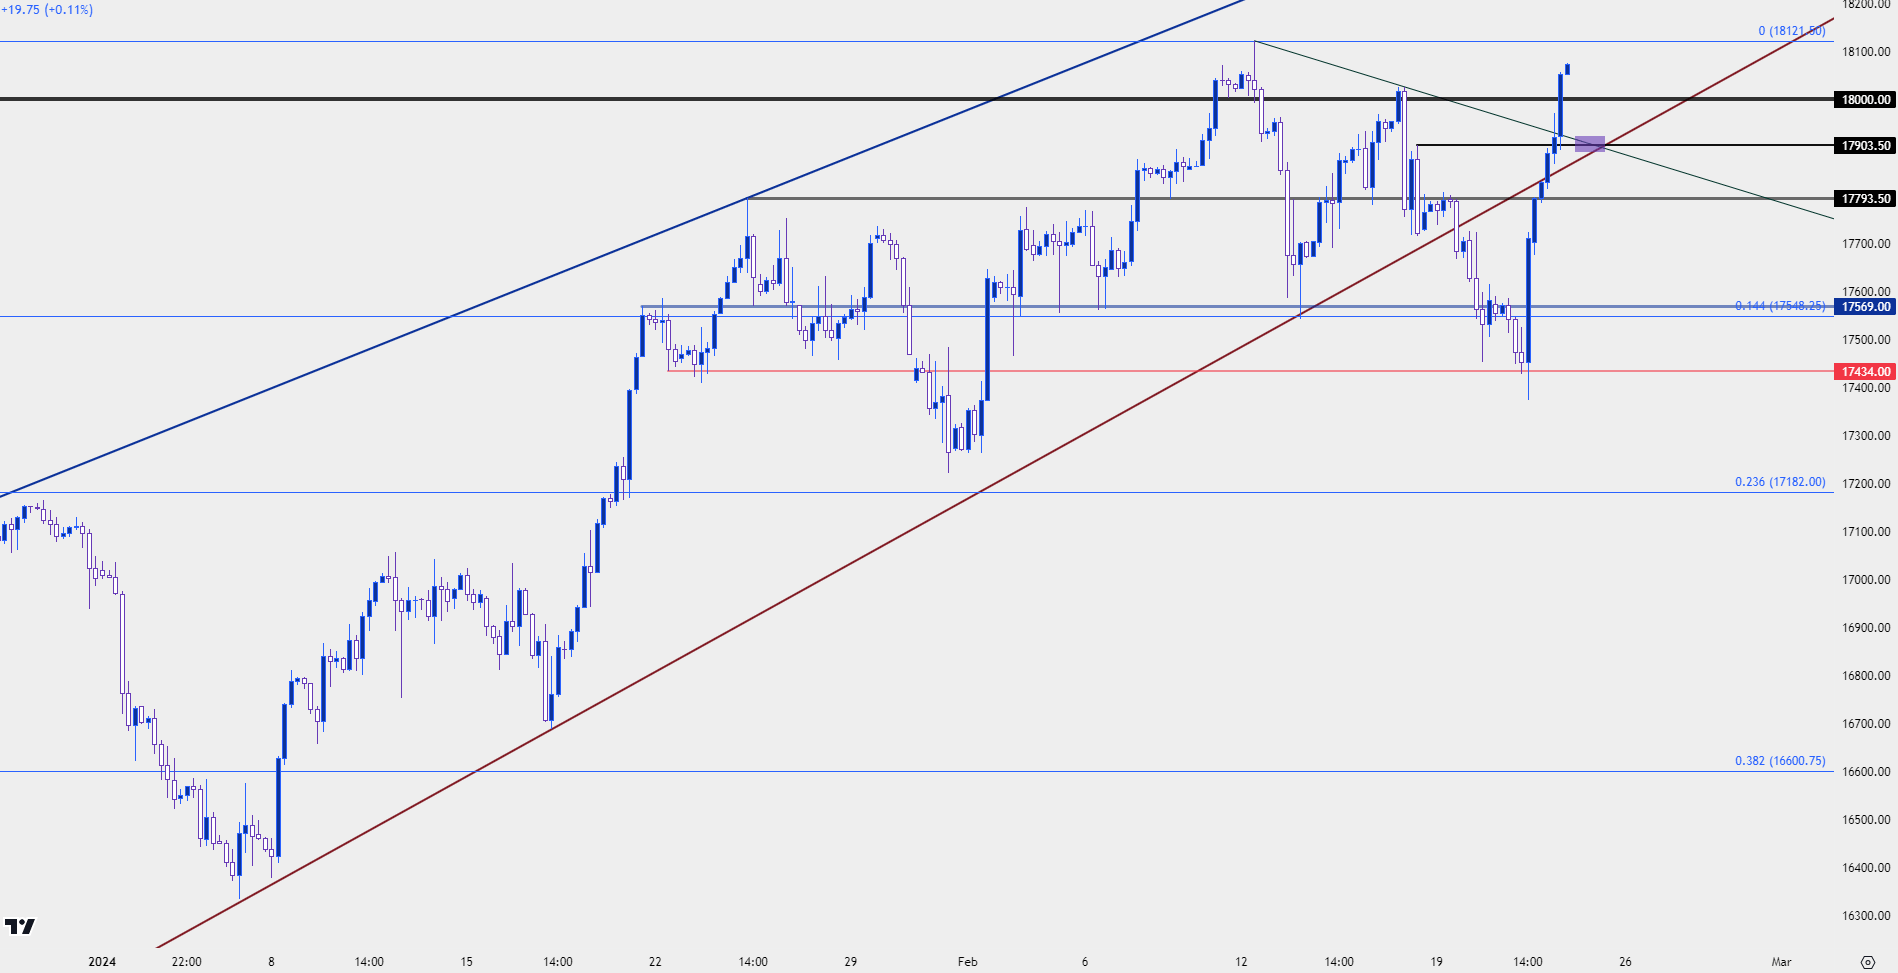 Chart prepared by James Stanley; data derived from Tradingview
--- written by James Stanley, Senior Strategist


