Equities Technical Forecast: Weekly Trade Levels
- Stocks remain constructive but advance may be vulnerable into uptrend resistance
- SPX500 targeting confluent uptrend resistance at 5223
- Nasdaq marks outside-range week at the highs- uptrend resistance eyed into 19000
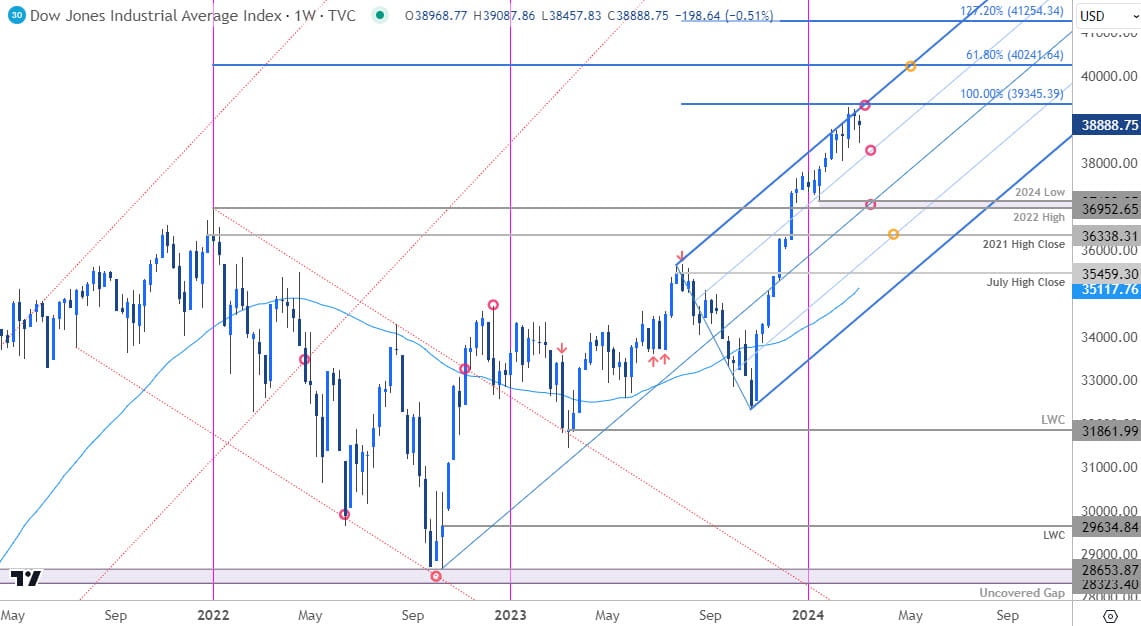
- Dow holding below confluent uptrend resistance of sixth-week—39345 key
Review my latest Weekly Strategy Webinar for an in-depth breakdown of these equity indices and more. Join live on Monday’s at 8:30am EST.
S&P 500 Price Chart – SPX500 Weekly
Chart Prepared by Michael Boutros, Sr. Technical Strategist; S&P 500 on TradingView
Technical Outlook: The S&P rallied for a third consecutive week with SPX500 up nearly 1% ahead of the close on Friday. The index has now rallied for 16 of the past 18 weeks with fresh record highs now marking a year-to-date advance of more than 8.6%. Although weekly momentum is deep in overbought territory, the daily timeframe continues to show a steady and orderly ascent and keeps the focus on this stretch higher.
Major technical resistance is eyed just higher around the 100% extension of the 2022 advance near 5223/50 – note that longer-term uptrend resistance slopes also converge on this region and highlight its technical significance over the next few weeks.
Initial support rests along the embedded channel (red) and is backed by the 75% parallel (blue), currently near ~5000 proper. Key support / broader bullish invalidation now raised to 4785/4820 – a region defined by the 2022 high-close / swing high and converges on the median-line of the ascending pitchfork extending off the 2022 low.
A topside breach / weekly close above the upper parallels is needed to fuel the next leg higher in price with subsequent resistance objectives eyed at the 1.272% extension at 5528- look for a larger reaction there IF reached.
Bottom line: The S&P 500 is approaching the first major technical hurdle since the 2024 breakout and while the broader outlook remains constructive, the immediate advance may be vulnerable in the weeks ahead. From a trading standpoint, look to reduce portions of long-exposure / raise protective stops on a stretch towards 5223/50 – ultimately, losses should be limited by the median-line IF price is heading higher with a close above this pivot-zone needed to fuel the next major leg.
Nasdaq Price Chart – NDX Weekly

Chart Prepared by Michael Boutros, Sr. Technical Strategist; NDX on TradingView
Technical Outlook: Nasdaq has rallied more than 10% year-to-date and while momentum remains on the side of the bulls, ongoing daily RSI divergence continues to suggest the topside may be vulnerable here. That said, the next technical resistance consideration is eyed at the upper parallel (currently ~19000) and the 100% extension of the 19549. Initial support rests at the 61.8% extension at 1745 backed by the median-line / 2021 high at 16764. Broader bullish invalidation now raised to the 2021 high-week close (HWC) at 16025.
Bottom line: Nasdaq is approaching uptrend resistance just higher with ongoing daily momentum divergence suggesting the rally may be vulnerable in the weeks ahead. From a trading standpoint, look to reduce portions of long-exposure / raised protective stops on a stretch towards 19000- losses should be limited to 16764 IF price is heading higher on this stretch with a close above the upper parallel needed to fuel the next major leg.
Dow Jones Price Chart – DJI Weekly

Chart Prepared by Michael Boutros, Sr. Technical Strategist; DJI on TradingView
Technical Outlook: The Dow has been trading into uptrend resistance for the past six-weeks with the 100% extension of the 2022 advance just higher at 39345- looking for a reaction into this zone with the immediate advance vulnerable while below.
Initial support rests with the 75% parallel (blue- currently near ~38200) backed by the 2022 high / the year-to-date low at 36952-37122- losses should be limited to this threshold IF price is heading higher. Broader bullish invalidation now raised to the 2021 high-close at 36338.
A topside breach / close above 39345 is needed to fuel the next leg higher towards the 61.8% extension of the 2020 advance at 40241 and the 127.2% extension at 41254.
Bottom line: Of the three indices, the Dow looks most vulnerable while below 39345. From a trading standpoint, a good zone to reduce portions of long-exposure / raise protective stops- losses should be limited to 36952 IF price is heading higher with a close above the upper parallel needed to fuel the next accelerated rally.
Key Economic Data Releases

Economic Calendar - latest economic developments and upcoming event risk.
Active Weekly Technical Charts
- Gold (XAU/USD)
- British Pound (GBP/USD)
- Euro (EUR/USD)
- Australian Dollar (AUD/USD)
- US Dollar Index (DXY)
- Japanese Yen (USD/JPY)
- Canadian Dollar (USD/CAD)
--- Written by Michael Boutros, Sr Technical Strategist with FOREX.com
Follow Michael on X @MBForex


