S&P 500, Nasdaq 100 Talking Points:
- It was a strong and consistent start to the year for U.S. equities, driven by the hope for rate cuts to begin later this year.
- At the final FOMC rate decision of Q1, the Fed reiterated their expectation for three 25 bp cuts in 2024 and given the calendar in which there are only four rate decisions in the second-half of the year, June will be a key point of emphasis for a possible start to those rate cuts. If that gets factored-out with employment and inflation remaining strong, that could lead to pullbacks in equities.
- While S&P 500 futures have continued to rip to fresh ATHs with RSI on the weekly nearing an 80-read, Nasdaq 100 futures have stalled over the past few weeks while building two different bearish formations.
- The Trader’s Course has been released: If you’d like to learn more about trading, there are three modules available on the topics of fundamental analysis, technical analysis, and price action. The Trader's Course.
U.S. equities have so far started 2024 exactly how it finished 2023: with very visible strength. And much like we saw at the November 1st FOMC rate decision, a continued dovish backdrop from the Fed has driven stocks to fresh highs. I looked into this theme in the 2024 Forecast for equities and I updated that view in the Q2 forecast, which you can access from the above link.
For Q2, it looks like there’s potential for a pullback. But the bigger question is whether that can turn into anything more or whether the Fed will encounter such a scenario with anything other than what we’ve seen over the past year, which is a clear dovish drive that’s kept equity bulls in the driver’s seat.
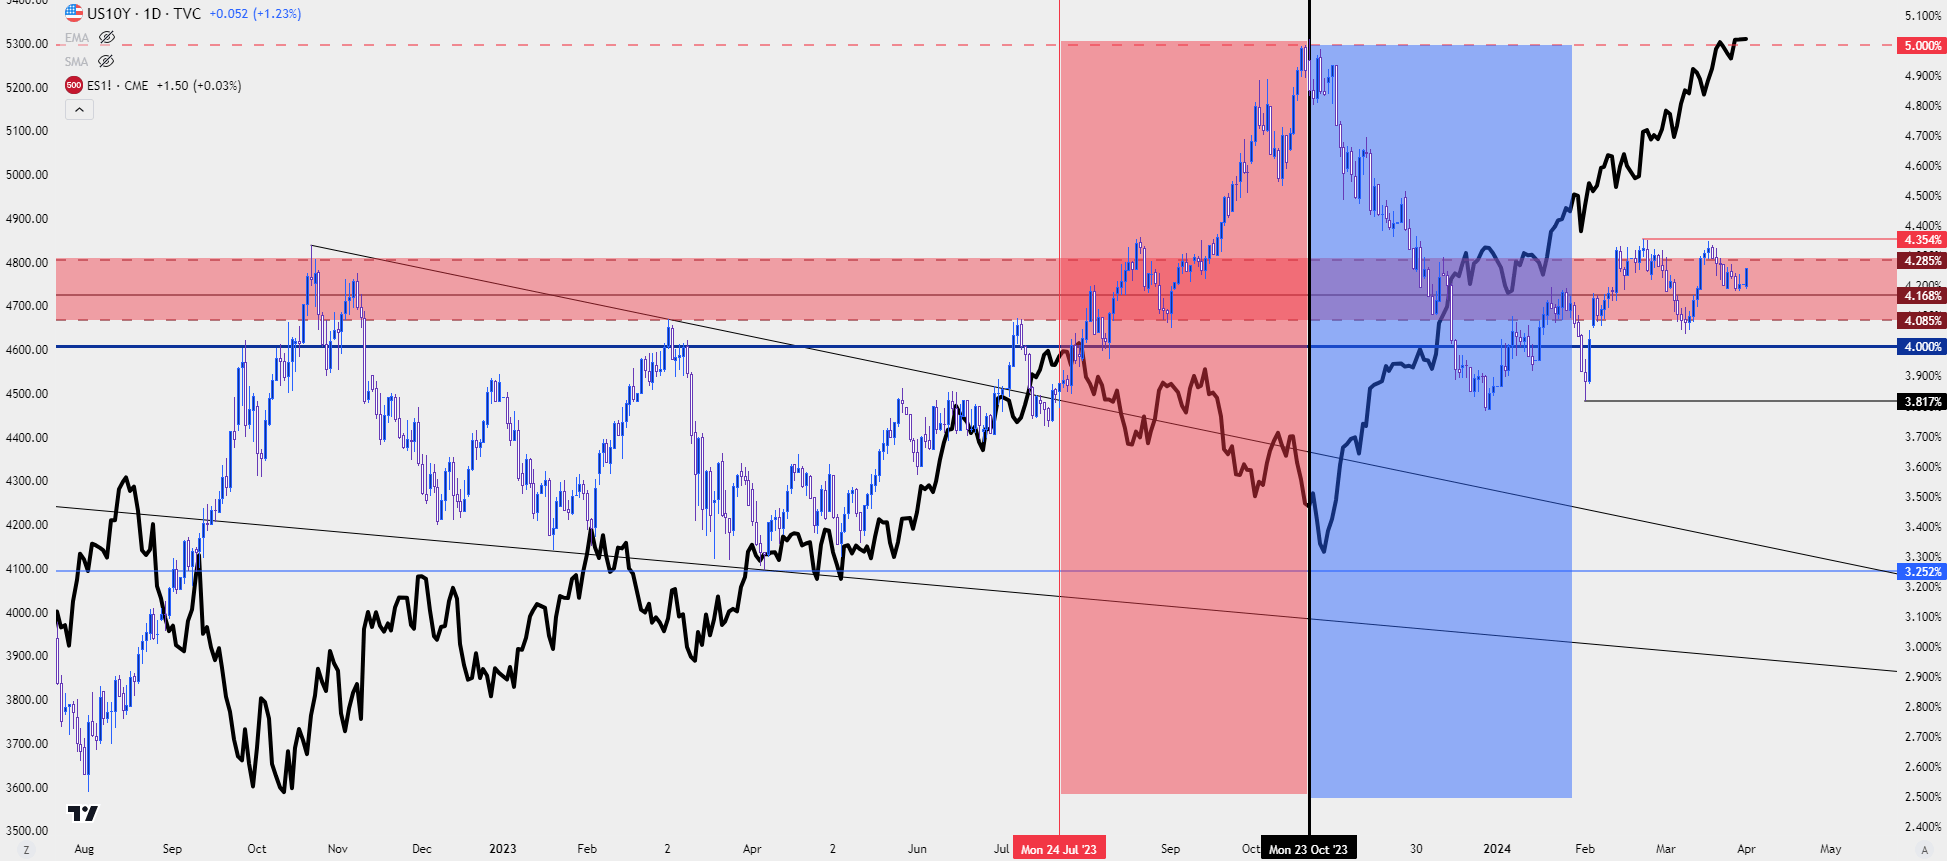
To be sure, there have been fits of fear over the past year, such as the pullback that developed last summer from the July highs which, eventually, found support just ahead of that November 1st rate decision from the Fed. That prior episode came along with a strong rally in the U.S. Dollar as long-term Treasury yields pushed to fresh highs.
The 10-year tagged the 5% handle in late-October. The S&P 500 bottomed a few days later and the final two months of Q4 trade saw Treasury yields drop quickly as stocks rocketed-higher.
S&P 500 futures have gained as much as 29.38% from that late-October low and that’s in less than half a year of trade. But a backdrop of a dovish Fed, falling Treasury yields and building hope for rate cuts helped to create that strong backdrop in stocks.
In Q1, U.S. Treasury yields started stabilize, however, and as we move into Q2 there’s topside potential for U.S. rates as can be seen on the below chart. Last quarter showed the 10-year grinding back above the 4% marker and as U.S. data has retained strength via both CPI and the labor market, those yields have continued to push higher. I’ve also added an overlay of S&P 500 futures as a black line to help illustrate this relationship in the second-half of last year, where the topping in yields synced well with the bottoming in stocks; and before that, how it was the hastening in higher yields that helped to tip equities-lower.
In late Q1-trade, yields continued to push higher but the S&P 500 remained strong, and this is a theme to be reckoned with at some point in Q2, with the expectation for either yields or equities to fall or pullback at some point.
U.S. 10-Year Treasury Yields and S&P 500 Futures (blue line)
 Chart prepared by James Stanley; data derived from Tradingview
S&P 500
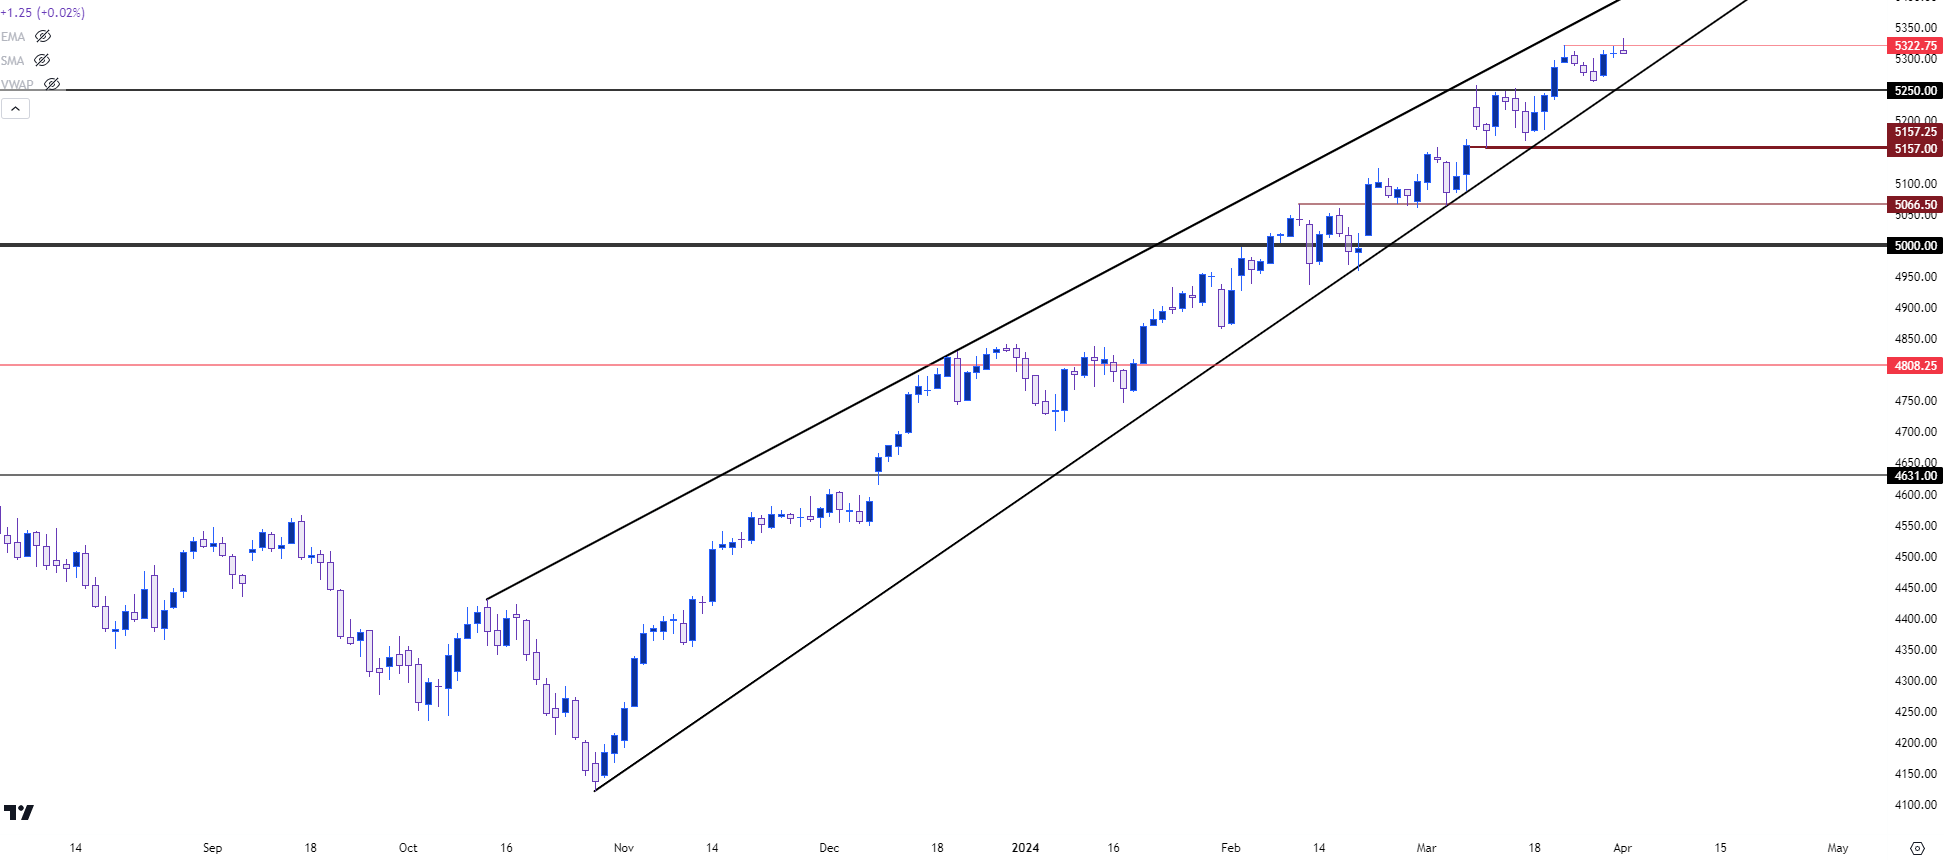
The rally in the S&P 500 remains impressive from a number of vantage points and there’s been a minimum of pullback in the bullish move so far. There were a couple of episodes of stall in Q1, however, such as the mid-February scenario which showed around that CPI print; or another that showed up in March just after a breakout that was fueled by the NFP report. But all along the way bulls showed up to support the bid to keep the index churning higher.
This has built into a rising wedge pattern given the aggressive reactions to support and the less emphatic price action when the index was testing or trading at fresh highs.
S&P 500 Futures – Daily Chart
 Chart prepared by James Stanley; data derived from Tradingview
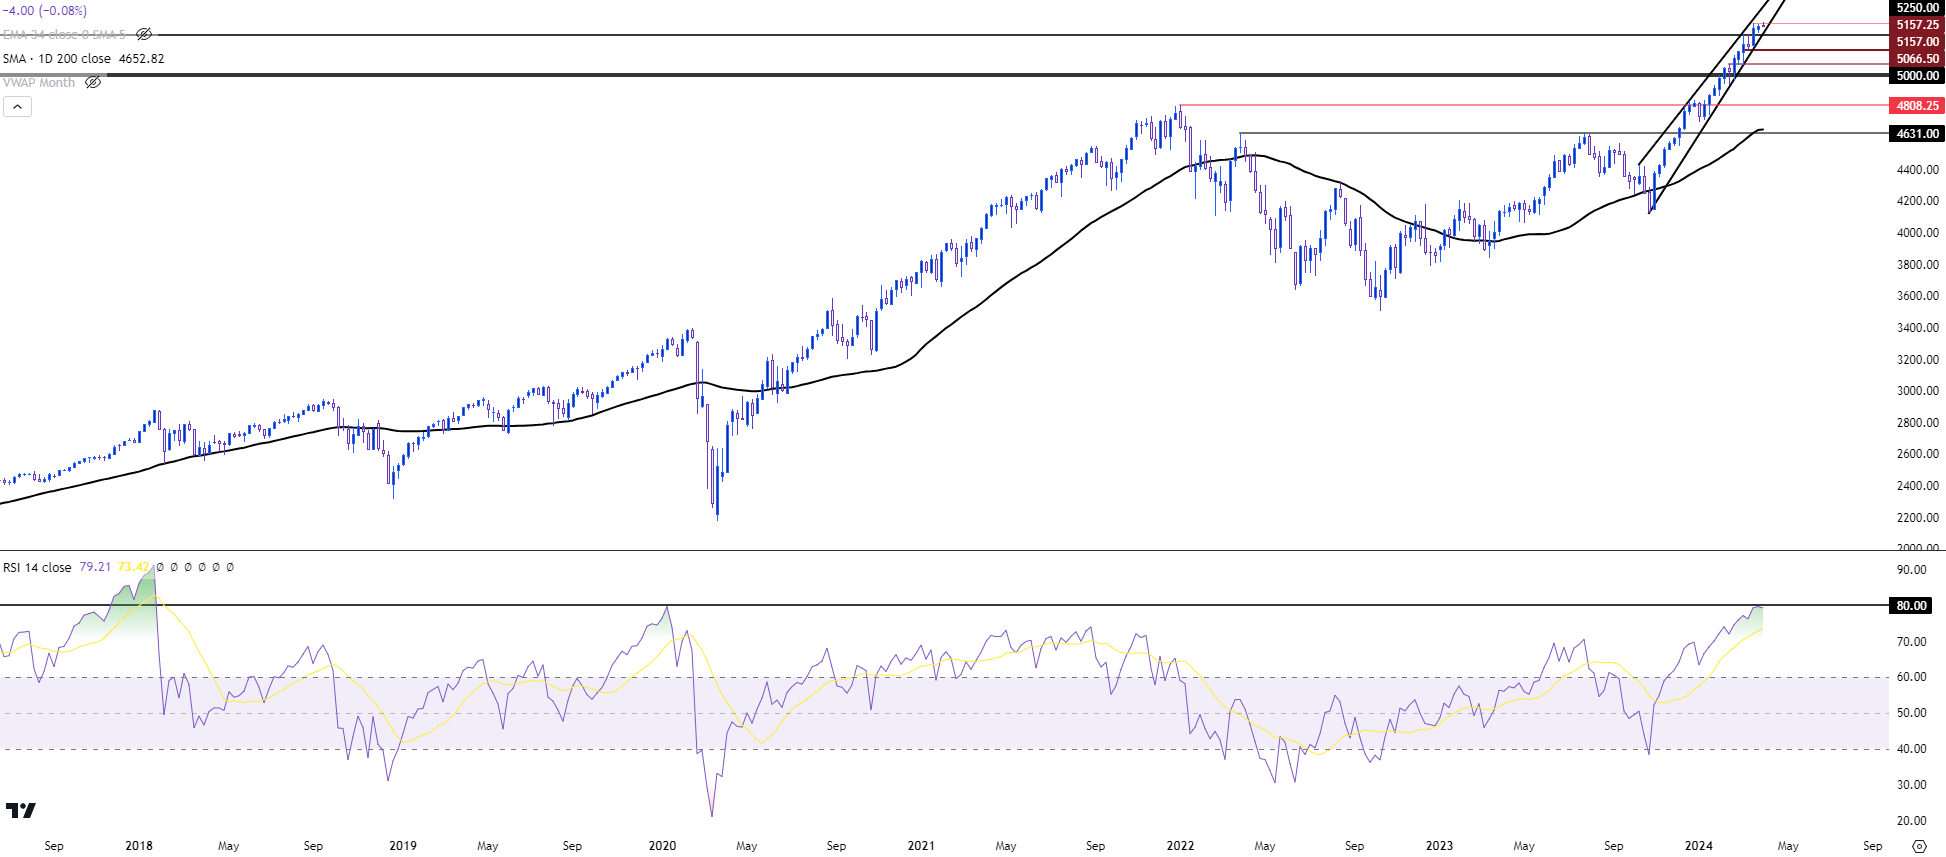
The weekly chart can offer some perspective here as RSI holds very near the 80-level, indicating just how long-in-the-tooth this trend has become. It’s Q1 closing value of 79.63 is the highest such read since January of 2020, which of course showed up just ahead of the Covid pullback. Outside of that, we have to go all the way back to 2017 to see such an overbought RSI reading on the index.
S&P 500 Futures – Weekly Chart
 Chart prepared by James Stanley; data derived from Tradingview
Nasdaq Cools into Q1 Close
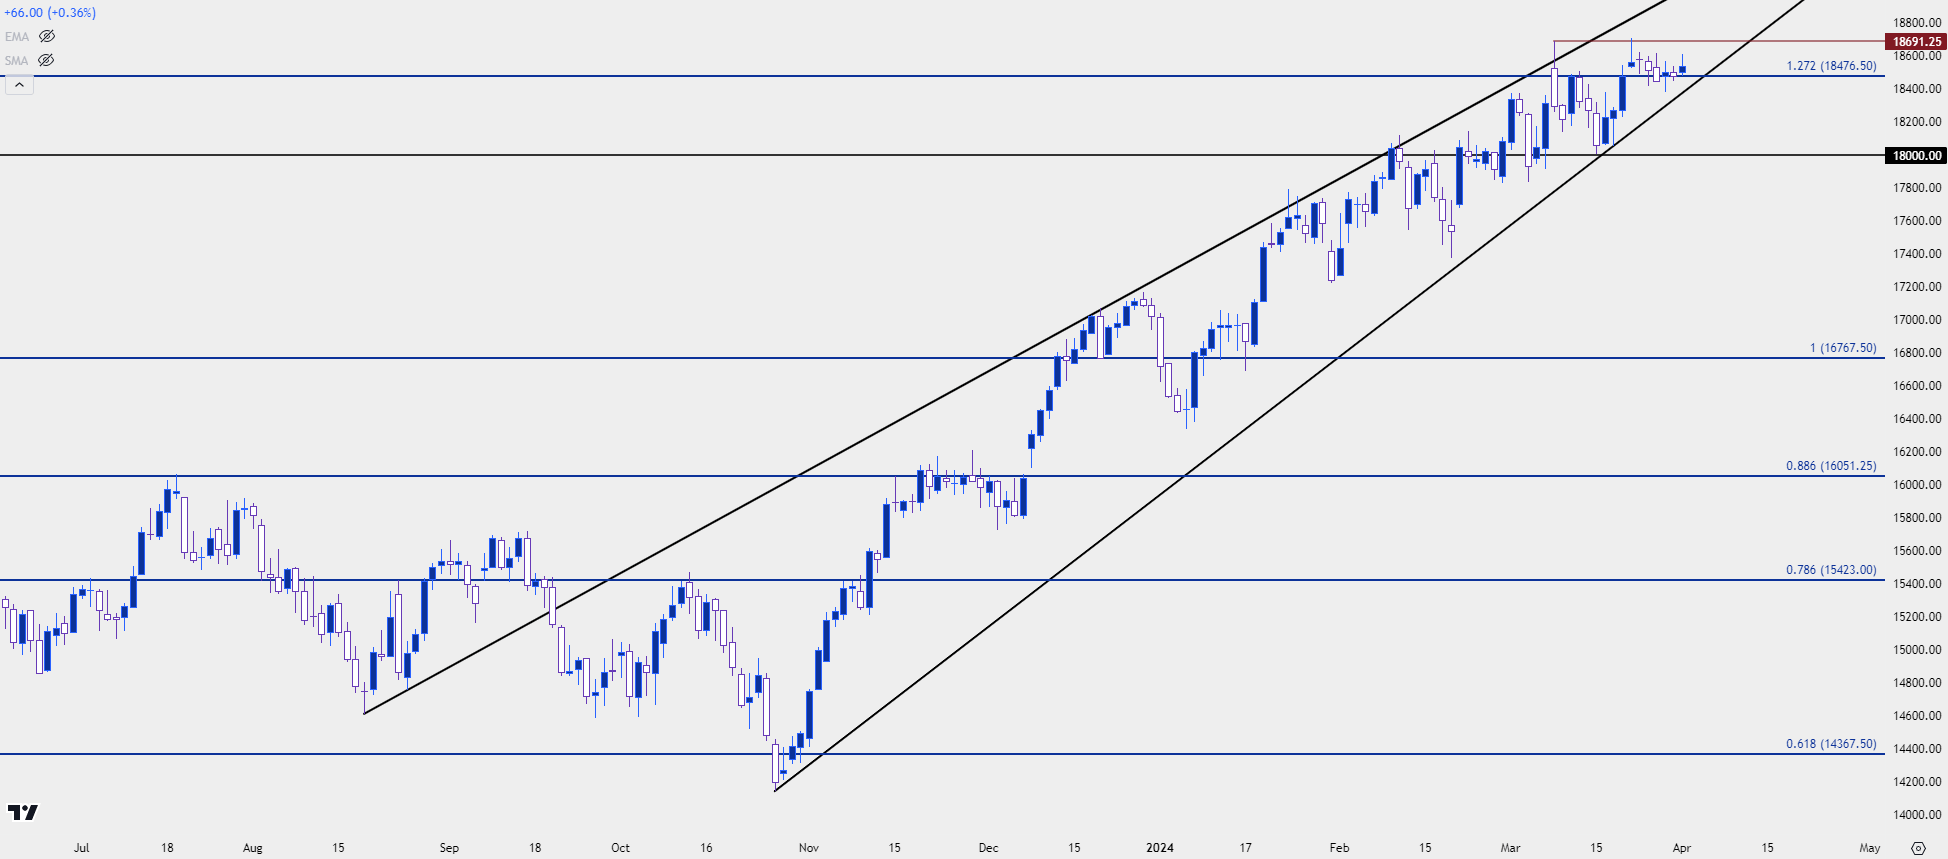
While S&P 500 futures ripped into quarter-end, the month of March was a bit more challenging for the tech-heavy Nasdaq. The index found resistance on NFP Friday at 18,691 and was unable to take that level out in the remainder of the month. There was a second test there, however, which sets up a possible double top formation; but that high would need to remain defended by bears. The double top is often approached with aim of bearish reversal but for the formation to play out, the neckline, or the low between the two highs, first needs to be broken and that plots around the 18k level on the chart.
There’s also a rising wedge in Nasdaq futures as shown below and this is also often approached with bearish aim.
At this point, the 27.2% Fibonacci extension of the 2022 pullback move remains a key spot on the chart, as this was prior resistance that’s started to show signs of support.
Nasdaq 100 Futures – Daily Chart
 Chart prepared by James Stanley; data derived from Tradingview
--- written by James Stanley, Senior Strategist


